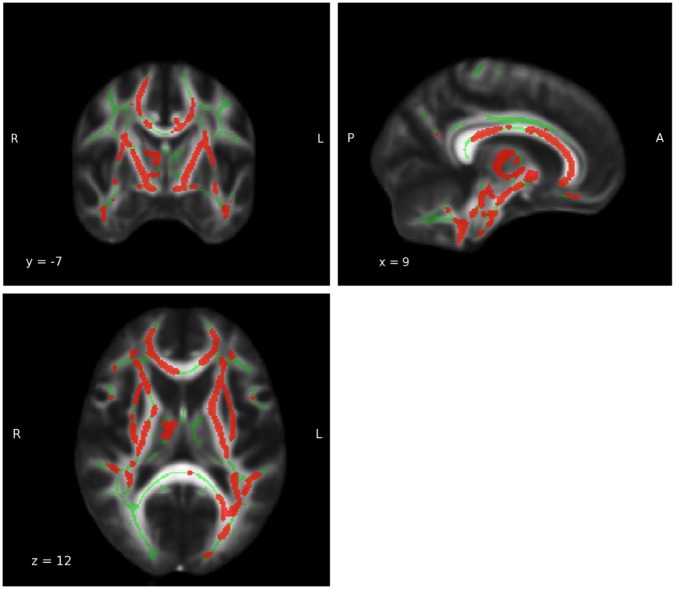
Figure 6.
Whole brain main effect age. For results of the whole brain analysis a significant and extensive main effect age was observed in a large part of the white matter (WM) (MNI coordinates: x = 9, y = −7, z = 12; PFWE−corrected = 0.05). The red area represents the results for main effect age. The green areas represent the WM skeleton of all participants.

