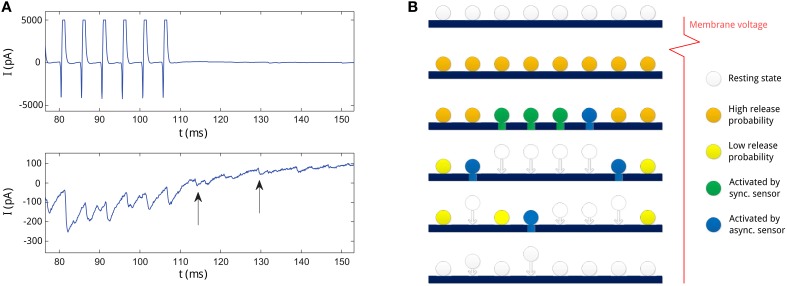
Figure 1.
(A) An example of asynchronous release recorded at a presynaptic neuron from Jiang et al. (2012). Upper panel: the membrane current at the presynaptic neuron. The current pulses represent action potentials at the presynaptic neuron. Lower panel: the IPSC at the postsynaptic neuron. Two asynchronous release events long after action potentials are indicated with arrows. (B) Illustration of the neurotransmitter release process in the SAR model for consecutive times (from upper to lower row) in the active zone. First row: at resting state, vesicles dock at the membrane in the active zone, the amount of Ca2+ bound to the Ca2+ sensors in the vesicles in low (indicated color by the white color). Second row: after an action potential, Ca2+ binds to the sensors on the vesicles (orange color), and vesicles have high release probability. Third row: soon after the action potential, some vesicles (marked green and blue) are activated by the Ca2+ sensors and start to release transmitters. Activation of vesicles can stem from the synchronous release (green) or the asynchronous release (blue) process competing for vesicles. Forth row: Vesicles released need to be replenished and newly recruited to the active zone (indicated with arrows). In this time, they are not available for release. Due to Ca2+ clearance process in the neuron, remaining available vesicles decrease in release probability (yellow). However, some vesicles are still activated by the asynchronous release sensors and start to release transmitters (blue). Some other vesicles are being replenished at the same time. Fifth row: as the release probability decreases, less vesicles are activated by the asynchronous release process. Last row: as Ca2+ is cleared, all vesicles return to the resting state and release is stopped. Neurotransmitter release will only be newly initiated by spiking activity.

