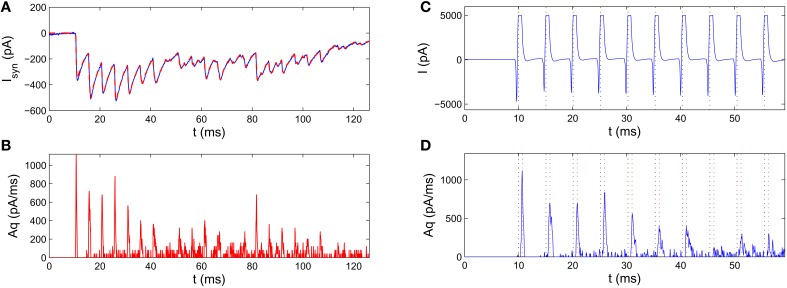
Figure 3.
Pre-processing of the raw IPSC recordings for estimating parameters of the SAR model. The experimental data was recorded from a synapse connecting a fast-spiking neuron to a pyramidal neuron in a human epileptic tissue (Jiang et al., 2012). (A) Blue curve: an example IPSC trace. Red dashed curve: the reconstructed IPSC trace based on the extracted release rate (from B). The two curves agree very well with each other. (B) Extracting release rate from experimentally measured IPSC traces. The scaled release rate extracted from the IPSC in A by the deconvolution method. (C,D) Estimation of the transmission delay by comparison of the time of spikes (black dotted lines) in the pre-synaptic voltage trace (C) and the peak of the release rate (D). Red dotted line mark the moments 0.75 ms after action potentials, which roughly coincide with the peaks of release rate indicating a constant transmission delay.

