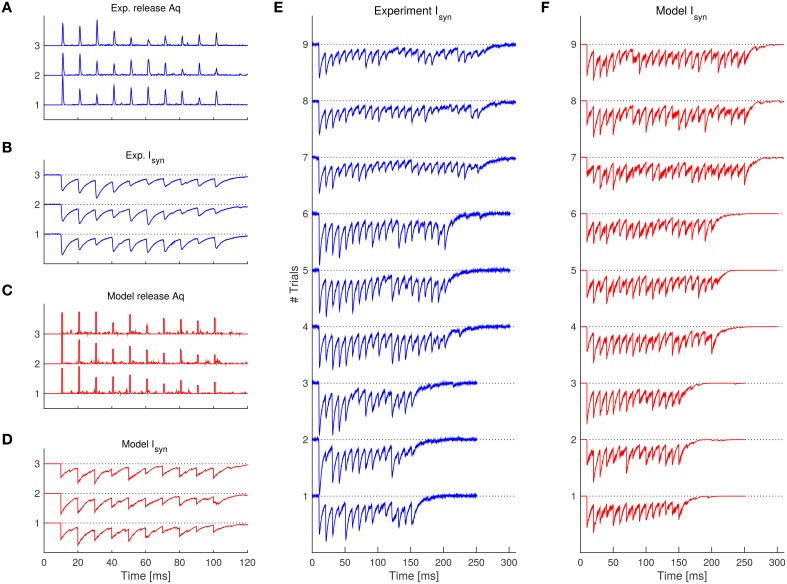
Figure 5.
Comparison of the experimental traces with the SAR model after fitting the parameters. (A) Experimentally observed release rate for the 3 trials having 10 spikes. (B) Experimentally observed synaptic current corresponding to the release rate in (A). (C,D) 3 example trials simulated with the SAR model with the same spike pattern as in (A,B). Note that simulated traces are qualitatively similar with the experimental data. (E,F) Synaptic current comparison of the rest of the experimental trials (E) and further example realizations of the SAR model (F). See Table 1 for parameters used. For (A,C), a boxcar filter with 1 ms width was used to better visualize the instantaneous release events.

