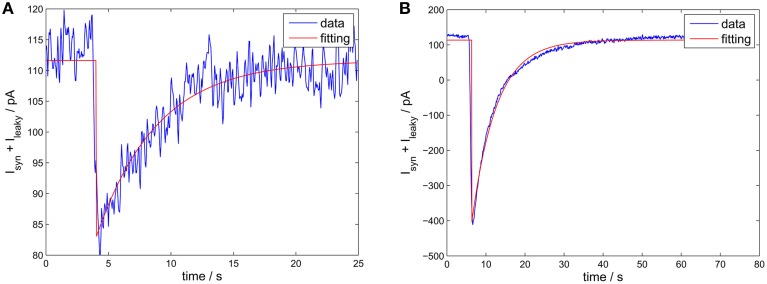
Figure 9.
Estimating the receptor decay time constant. The experimental data is from a synapse of epileptic human tissue connecting a fast-spiking interneuron with a pyramidal neuron. Blue curve: the IPSCs. Red curve: the fitted IPSC using an exponential decay function (with offset). (A) A spontaneous release event. The estimated τGABA was 4.8 ms (confidence interval 4.39–5.27 ms). (B) Single action potential triggered release. The estimated τGABA was 6.2 ms (confidence interval 6.06–6.46 ms).

