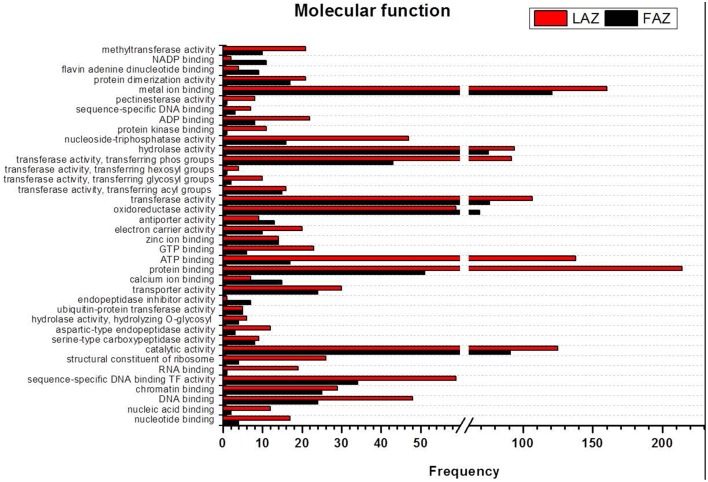
Figure 5.
Comparison of frequencies of the GO “molecular function” term of over-expressed transcripts in the LAZ (Group A) and FAZ (Group B). The bars represent the comparison of the occurrence frequencies of the GO “molecular function” term in the GO annotations of 1135 and 2066 over-expressed transcripts in the FAZ and LAZ, respectively. The frequencies are given for the most abundant molecular functions.

