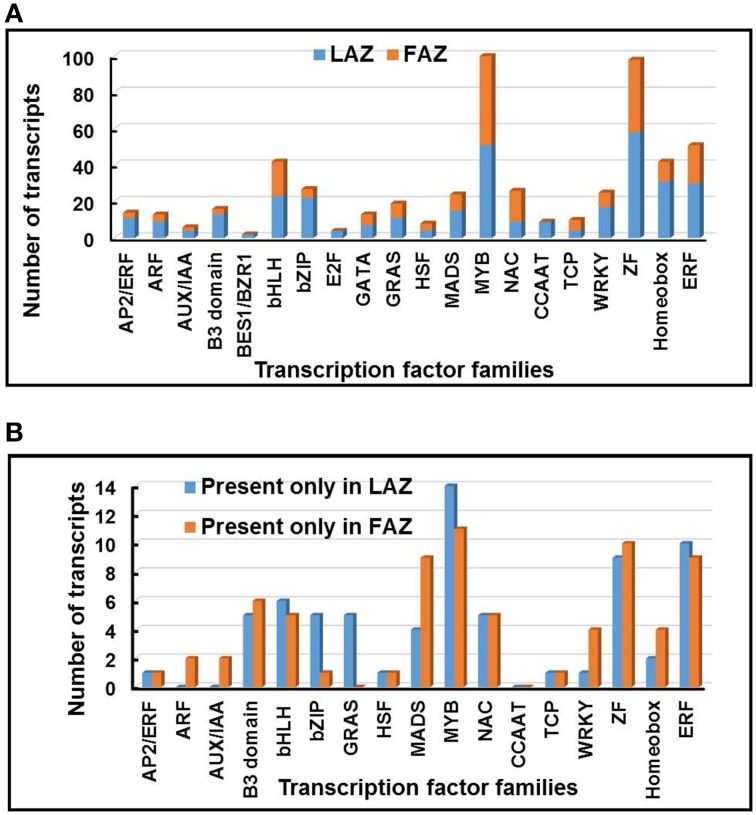
Figure 7.
Distribution of abscission-regulated transcription factor (TF) families over-expressed in the LAZ or in the FAZ (A), and exclusively expressed only in the LAZ or FAZ (B) during abscission. The changes in the abundance of 551 TF transcripts belonging to 20 families were determined in graph (A) for Group A (LAZ) and Group B (FAZ). The changes in the abundance of 141 TF transcripts belonging to 20 families were determined in graph (B) for Group A1 (LAZ) and Group B1 (FAZ). The Groups were classified according to the categories presented in Figure 2.

