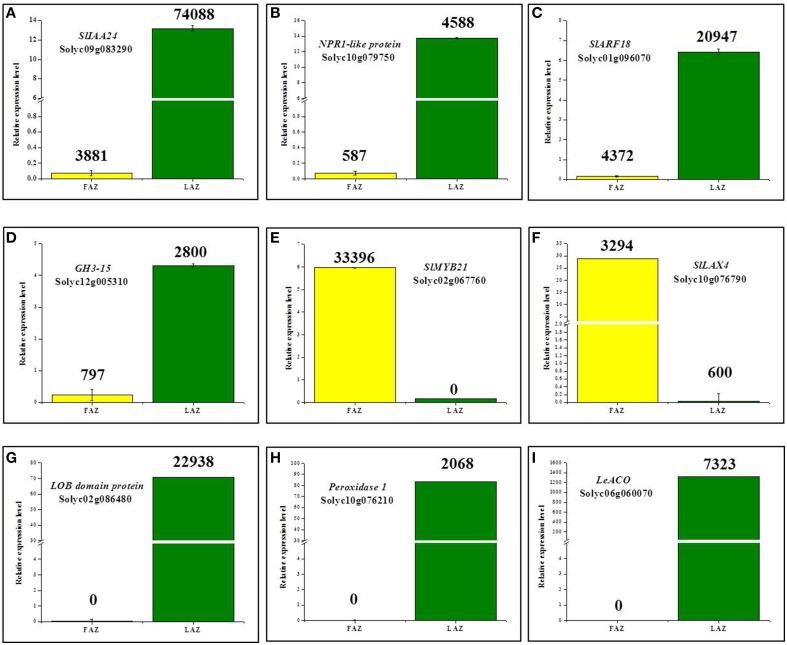
Figure 8.
Validation by qPCR of differential expression patterns of selected genes in the FAZ and LAZ pooled samples following abscission induction. Expression levels were measured for tomato Aux/IAA24 (SlIAA24) (A), NPR1-like protein (B), Auxin response factor18 (SlARF18) (C), Gretchen Hagen3-15 (GH3-15) (D), SlMYB21 (E), Like Aux4 (SlLAX4) (F), LOB domain protein (G), Peroxidase1 (H), and 1-Aminocyclopropane-1-Carboxylate-Oxidase (LeACO) (I). The relative quantification of the gene expression level in the qPCR assay was determined by the comparative CT method 2−ΔΔCT, using ACTIN as a reference gene. The results are means of three biological replicates ± SD. The values presented on top of each bar indicate the expression levels derived from the RNA-Seq data. Transcript identities are indicated in the graphs by their gene ID. The qPCR and RNA-Seq analyses were performed with different samples taken from independent biological replicates of two separate experiments.

