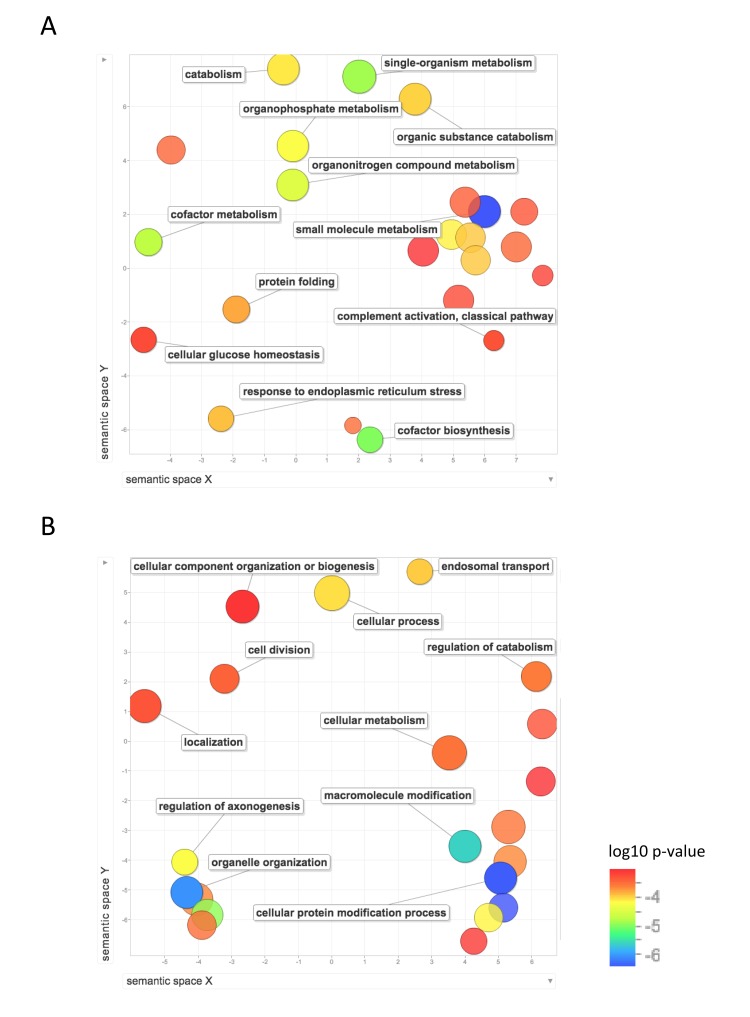
Figure 5. Functional annotation of protein-coding genes more highly expressed in short-lived species.
Enrichment analysis visualized as an MDS plot for GO biological processes that are (A) higher in mouse than NMR (B) higher in mouse than human. Plots are generated based on a matrix of semantic similarities in space (x, y). Clusters of circles closer together represent terms that are more closely related. Circle color and size indicates log10 p-value.

