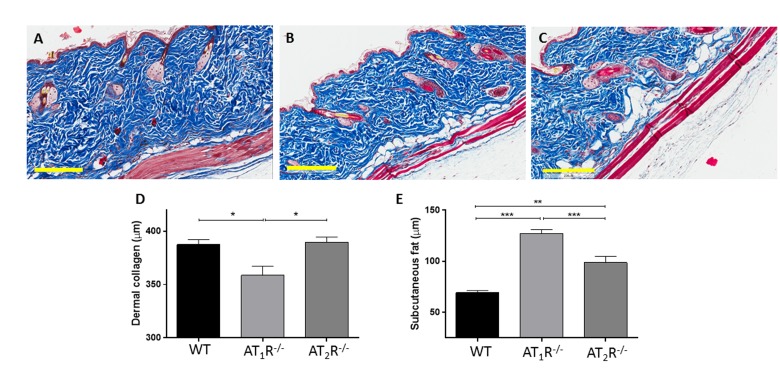
Figure 9.
Masson's trichrome staining of skin sections from WT (A), AT1R−/− (B) and AT2R−/− (C) mouse cohorts shows an expanded zone of subcutaneous fat in the angiotensin knockout mice. Quantification of the thickness of the zones of dermal collagen and subcutaneous fat in wild-type and mutant mice is shown. Scale bar 200 μm. *p<0.05, **p<0.005, ***p<0.0005.

