Figure 2.
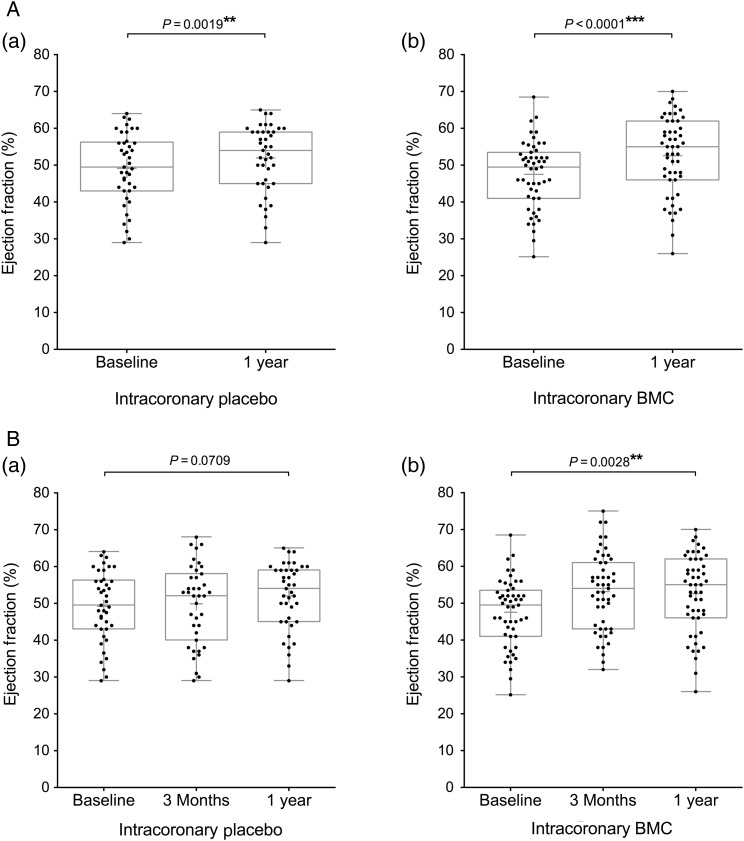
Endpoint analysis of left ventricular ejection fraction. Box and whisker plots (median and range, mean shown by +) including individual data points of left ventricular ejection fraction measured at (A) baseline and 1 year (significance measured by paired t-test); (B) baseline, 3 months, and 1 year (significance measured by repeated measures analysis of variance). Participant groups (a) intracoronary placebo infusion, (b) intracoronary BMC infusion.

