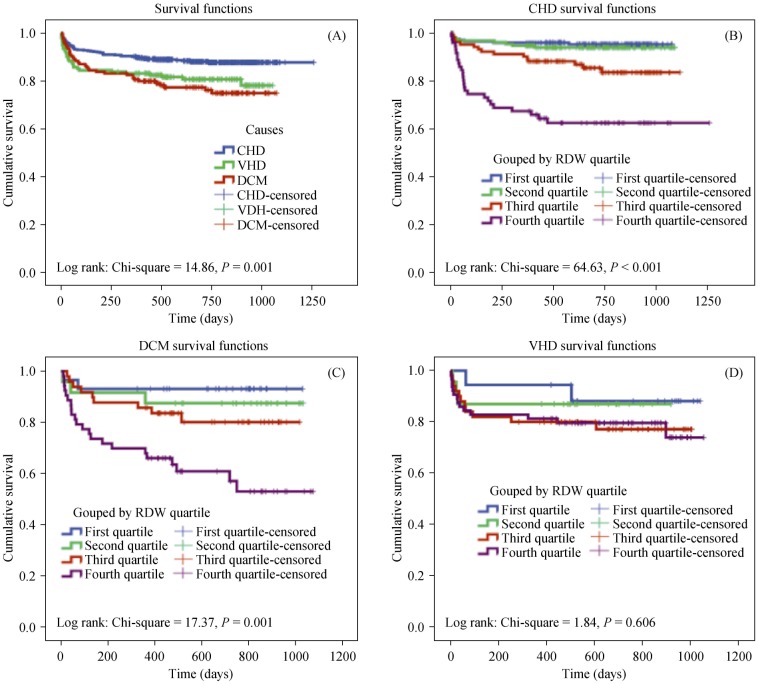
Figure 2. Survival curves for patients with heart failure of different etiologies.
Kaplan–Meier survival curves showing the total HF patients with heart failure (A); HF patients due to coronary heart disease (B); dilated cardiomyopathy (C); and valvular heart disease (D) grouped by RDW quartile. CHD: coronary heart disease; DCM: dilated cardiomyopathy; HF: heart failure; RDW: red cell distribution width; VHD: valvular heart disease.

