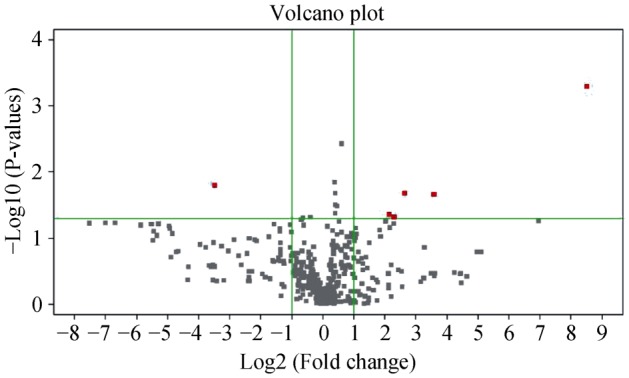
Figure 1. Volcano plots showing the differentially expressed miRNAs in AAD patients.

The X axis represents the log 2 fold change compared with healthy control subjects and the Y axis represents −log10 P-values obtained from the t test comparing the mean normalized miRNA signal in AAD patients to that in healthy control subjects. Top righted dots represent up-regulated miRNAs with a fold change >2, while left righted dots represent down-regulated miRNAs with fold change >2 in dissection patients compared with that of healthy control subjects. AAD: acute aortic dissection.
