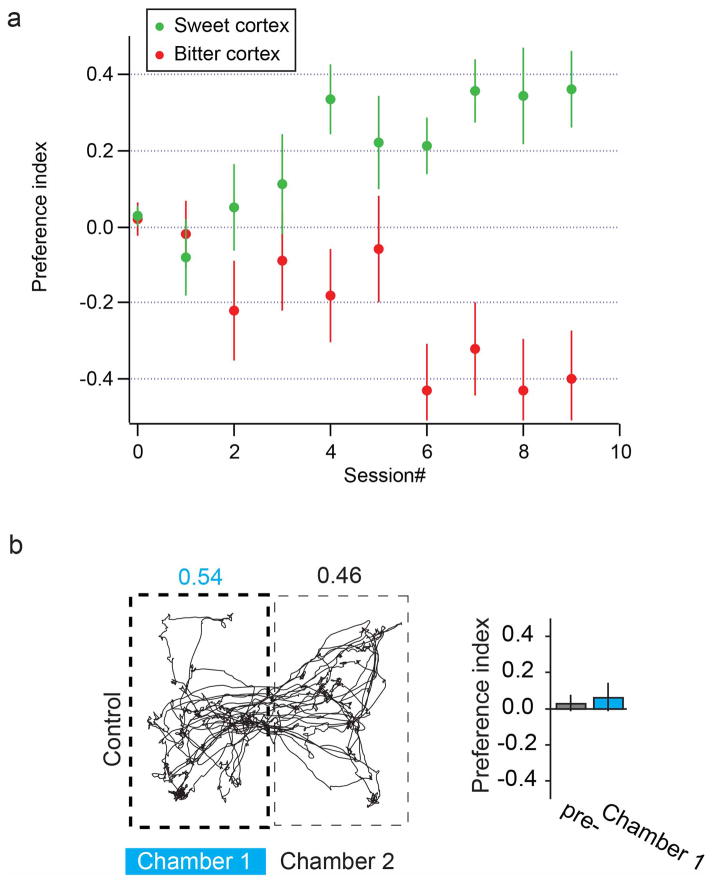
Extended Data Figure 2. Acquisition of Place preference.
a, The graph shows the development of “place preference” as a function of session number (each session was 30 min of training and 5 min of “after-training” testing in the absence of light stimulation; n = 13 for sweet cortex, n = 15 for bitter cortex; see text and Methods for details). The average of sessions 6–8 were used in Fig. 1. Values are mean ± s.e.m. b, Representative mouse track and quantitation of preference index in control GFP-expressing mice; note no difference in preference between chambers (n = 14; Mann-Whitney U test, P = 0.74). Values are mean ± s.e.m.

