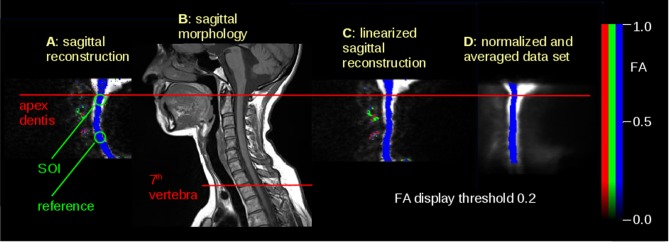
Figure 1.
Illustration of the normalization process. (A) Sagittal reconstruction of axial DTI scans – FA map (blue = apical-basal), crosshairs at apex dentis. Background is the (b = 0)-scan. (B) Sagittal morphological T1w scan to calculate the distance between apex dentis and seventh vertebra, as indicated by lines. (C) Axially normalized FA map of (A). (D) Template obtained from axially normalized FA maps; slices of interest (SOIs) are indicated by horizontal lines. DTI, diffusion tensor imaging; FA, fractional anisotrophy.

