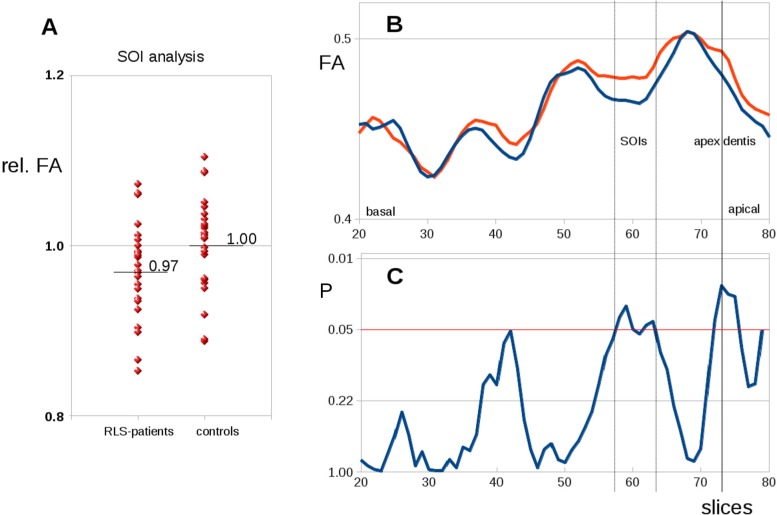
Figure 3.
(A) Group differences between patients with restless legs syndrome (RLS) and controls of fractional anisotrophy (FA) values in operator-defined slices of interest (SOI) within the spinal cord. (B) Group averaged slicewise FA values along the cervical spinal cord for patients with RLS (red) and controls (blue). (C) Differences along the cervical spinal cord (T test values, significance level P < 0.05, uncorrected).

