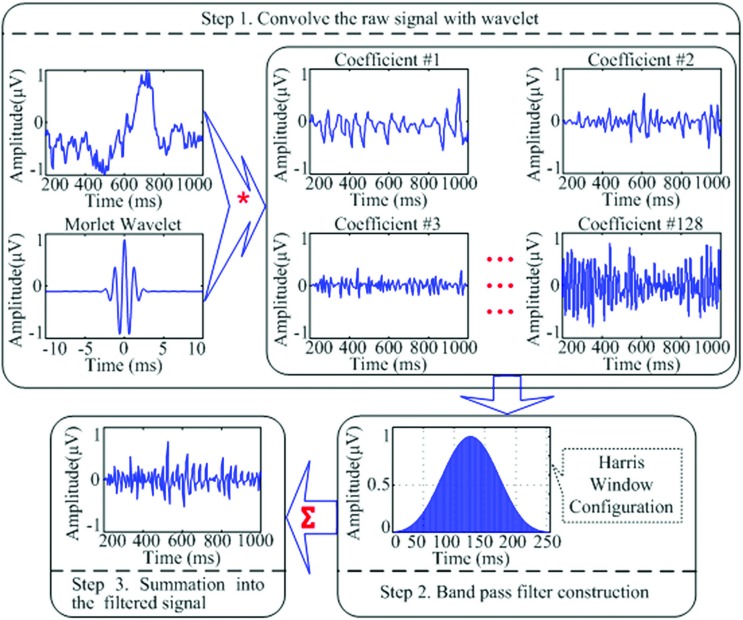
Figure 1.
A schematic representation of the wavelet transformation and band-pass filtering applications utilized to filter raw EEG signal into the desired filtered signal to be used for relative power calculation of the EEG bands of interest. “*” Means the process of “convolution”; “∑” means the process of “summation”; the three lines of “…” are the ellipsis points, which means in the similar fashion from “Coefficient #3” to “Coefficient #128.”

