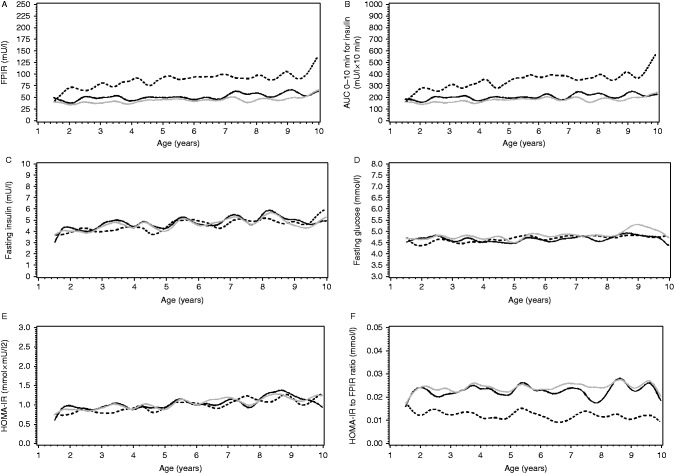
Figure 2.
Mean values of the study variables ((A) FPIR, (B) AUC0–10 min for insulin, (C) fasting insulin, (D) fasting glucose, (E) HOMA-IR index and (F) HOMA-IR to FPIR ratio) in cubic splines between the non-progressors and progressors as a function of age (years). The solid line shows the values of the progressors. The black line represents the values when the last 2 years prior to diagnosis were excluded. The grey line represents the values when the last 2 years prior to diagnosis were included. The black dotted line represents the non-progressors. (C, D and E) Fasting insulin increased 3.9%/year, fasting glucose 0.50%/year and HOMA-IR index increased 4.4%/year (P<0.001, P=0.0024 and P<0.001 respectively).

 This work is licensed under a