Fig. 1.

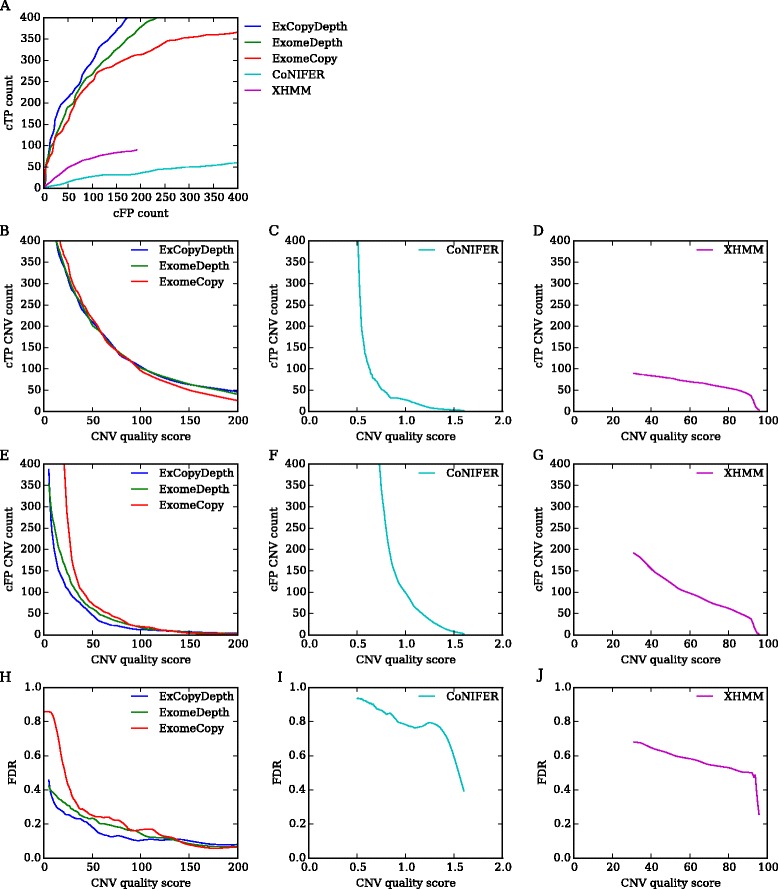
Cumulative TP (cTP) count and cumulative FP (cFP) count distribution for five programs tested in the study. a cTP count vs cFP count for each quality score of the prediction program. b, c, d cTP count distribution vs CNV quality score. e, f, g cFP count distribution vs CNV quality score. h, i, j False Discovery Rate (FDR) vs CNV quality score for five programs. FDR: False positive CNVs/(True positive CNVs + False positive CNVs). All the programs showed a decrease in FDR with increasing quality score (Pearson correlation coefficients (r) - ExomeCopy: r = −0.49, p = 2.50e-21; ExCopyDepth: r = −0. 56, p = 1.44e-74; ExomeDepth: r = −0.64, p = 7.82e-105; CoNIFER: r = −0.63, p = 0.00; XHMM: r = −0.98, p = 4.34e-269). Quality scores of different prediction programs have different ranges, therefore scores are presented in different figures. CoNIFER SVD-ZRPKM values range from −3 - +3, thus absolute values are presented in Fig. 1c, f
