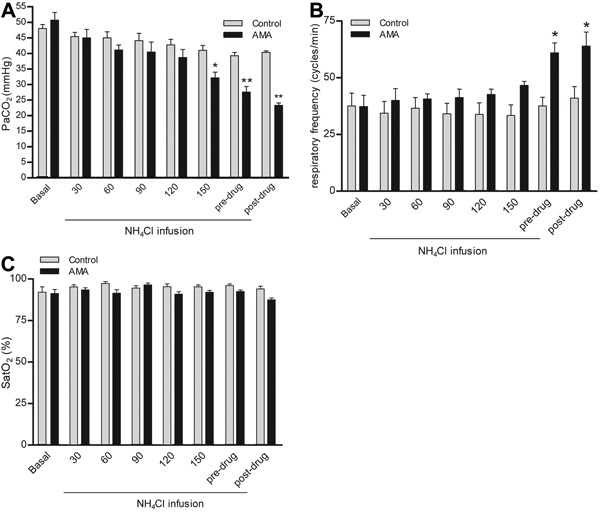
Figure 4. A, Partial pressure of arterial carbon dioxide (PaCO2), B, respiratory frequency, and C, oxygen saturation (SatO2) in response to acute metabolic acidosis (AMA). Basal, pre-drug (before dose-response curves), and post-drug (after dose-response curves) data are reported as means±SE. *P<0.01 compared to control (two-way repeated-measures ANOVA and Bonferroni post-test; n=8).

