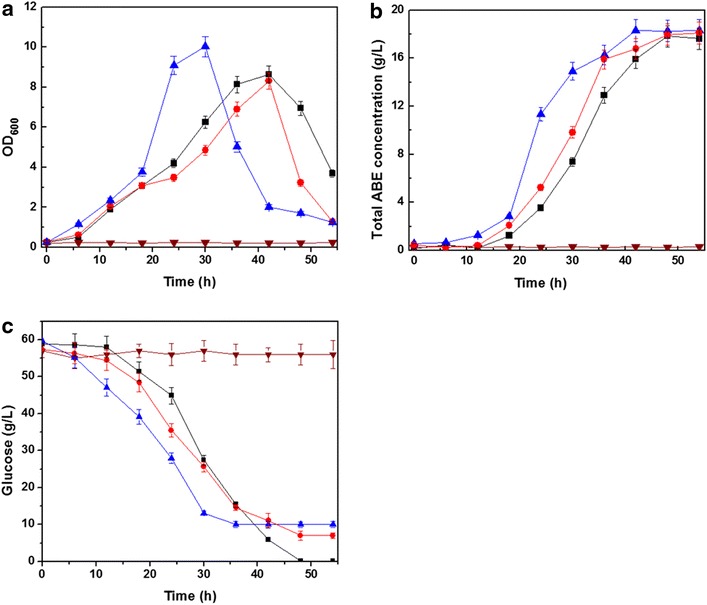
Fig. 3.

Biomass, ABE solvents, glucose concentration by symbiotic system and single culture of C. acetobutylicum TSH1. a Time courses of biomass (OD600), b Time courses of ABE solvents concentration, c Time courses of glucose consumption. Filled triangle C. acetobutylicum TSH1 with anaerobic treatment, filled inverted triangle C. acetobutylicum TSH1 without anaerobic treatment, filled square symbiotic system with 0.15 L/min (0.05 vvm) air flushing filled circle symbiotic system without anaerobic treatment
