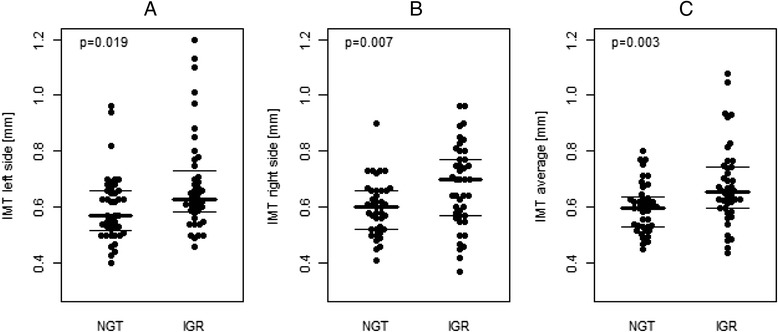
Fig. 1.

Comparison of IMT measurements. Bee swarm plot of carotid IMT data in normal glucose tolerant hyperlipidemic patients (NGT) vs. hyperlipidemic patients affected by impaired glucose regulation (IGR): left side (a), right side (b), average (c). Lines indicate first, second (median) and third quartiles
