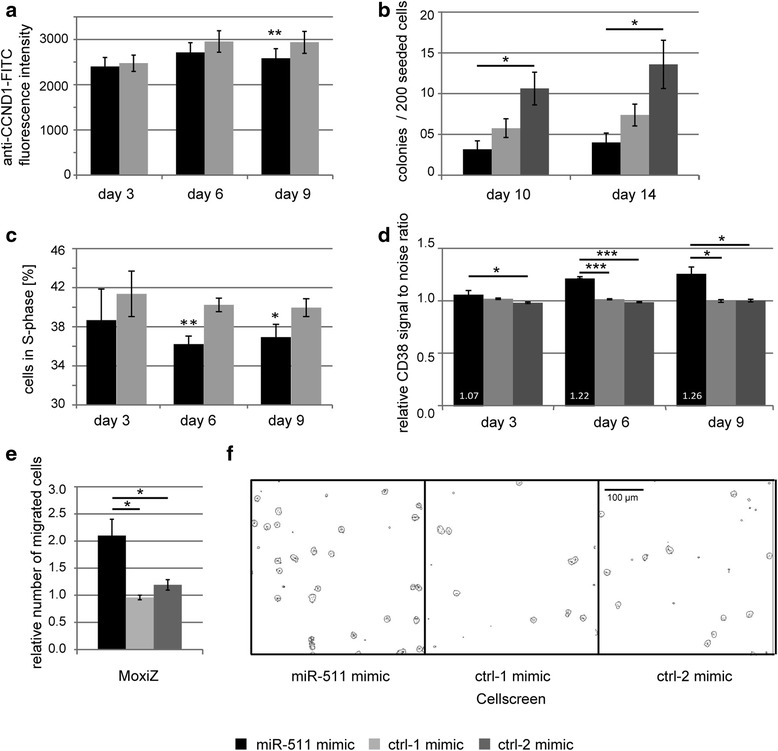
Fig. 6.

Cellular effects of miR-511 mimic treatment in THP1 cells. a Effect of miR-511 mimic treatment on cyclin D1 protein expression of THP1 cells measured by flow cytometry (median fluorescence intensity). b Mean colony number formed by THP1 cells 10 and 14 days after having been transfected three times over a time frame of 10 days with miRNA mimics. c Effect of miR-511 mimic treatment on proportion of THP1 cells in S-phase. d Effect of miR-511 mimic on surface expression of monocytic marker CD38. e Effect of miR-511 mimic treatment on migratory capability of THP1. On day 8 after miRNA mimic transfection, cells were left migrating through 5 μm transwells for 20 h. Number of migrated cells was counted via MoxiZ cell counter and Cellscreen microscopy with equal results. f Representative pictures of Cellscreen microscopy of migrated THP1 cells are shown. Columns show mean over four (a, c) or three (b, d, e) independent experiments, bars indicate standard error of the mean. Black: miR-511 mimic treatment, light grey: negative control #1 mimic treatment (ctrl-1 mimic), dark grey: negative control #2 mimic treatment (ctrl-2 mimic). * p < 0.05; ** p < 0.005
