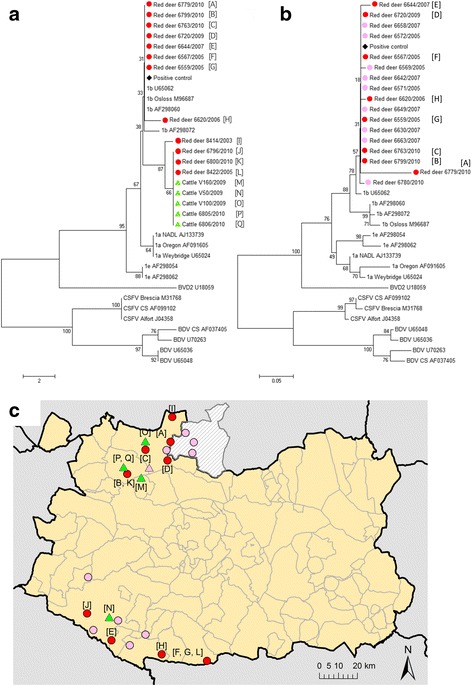
Fig. 1.

Phylogenetic trees of BVDV 5’-UTR sequences identified in red deer and cattle in the study area and pestivirus reference sequences [38]. a Phylogenetic tree based on sequences amplified from red deer and cattle by Taqman RT-PCR. b Phylogenetic tree based on sequences amplified from red deer by nested RT-PCR. Trees were constructed using the neighbor-joining algorithm [45]. Bootstrap percentage values were calculated from 1000 resamplings; values over 50 % are displayed. c Location of samples positive by RT-PCR that were taken from red deer and cattle. A black diamond denotes the place for the bovine field sample used as a positive control, while the grey circles indicate red deer samples, and the grey triangles samples from cattle. In the phylogenetic trees, the species, identification number and year of sampling are shown under the corresponding symbol. Letters in brackets (e.g. [A]) correspond to the sampling locations shown in the map in panel C
