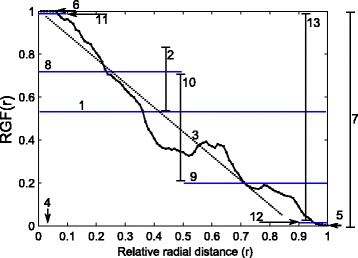
Fig. 4.

Example of radial glandular fraction (RGF) features (as listed in Table 1) that were evaluated for the classification of the fibroglandular distribution: (1) mean value and (2) standard deviation of the 100 RGF values, (3) slope of the linear fit of RGF values versus relative radius, (4) radial position (r) of the maximum RGF value, (5) the minimum value of RGF, (6) the maximum value of RGF, (7) the difference in the maximum and minimum values of RGF, (8) mean of RGF values for which relative radial distance was less than or equal to 0.5 (mean of inner 50 %), (9) mean of RGF values for which relative radial distance was greater than 0.5 (mean of outer 50 %), (10) the difference in the mean of inner and outer 50 %, (11) mean of the highest 10 % of RGF values (mean of highest 10 %), (12) mean of the lowest 10 % of RGF values (mean of lowest 10 %), and (13) the difference in the mean of highest and lowest 10 %
