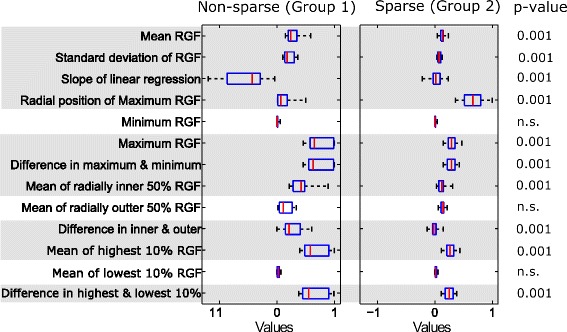
Fig. 7.

Texture features from the middle region. Box plots of texture features from the middle region for two groups: non-sparse and sparse. In each box, median is marked by a central mark (red), the 25th and 75th percentile are the edges of the box (blue), and error bars represent the range. Features which had significant differences (p <0.05) are highlighted in grey
