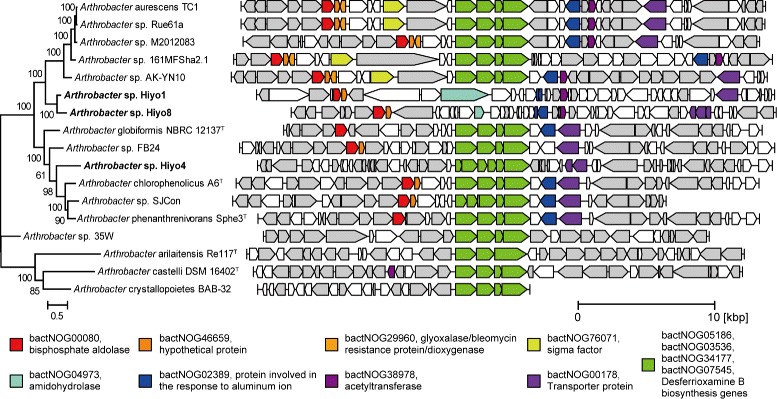
Fig. 3.

Syntenic map around siderophore-synthesis gene clusters in Arthrobacter genomes. Arrows represent genes whose lengths are proportional to the gene lengths. Desferrioxamine B biosynthesis genes are shown in green. Other conserved genes are shown in different colors according to their annotation. Other genes annotated using the eggNOG database are shown in gray. The phylogenetic tree was reconstructed on the basis of the set of 400 conserved bacterial marker genes with 1000 bootstrap replicates by the maximum-likelihood method
