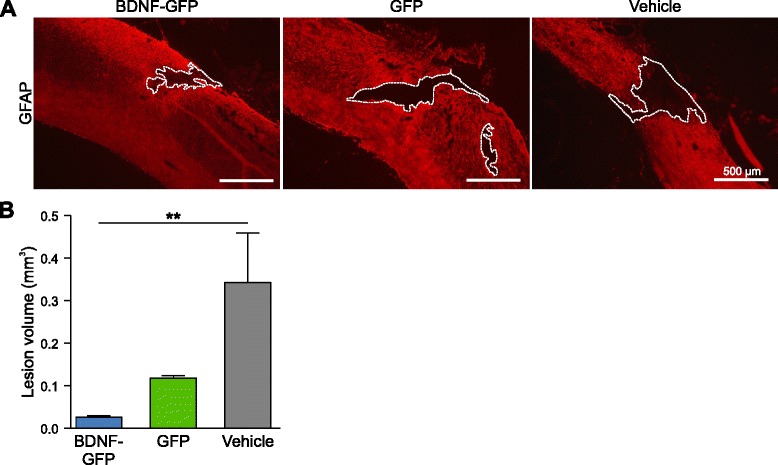
Fig. 5.

Analysis of lesion volume in injured mice. a Representative micrographs of GFAP-stained sections from BDNF-GFP cell-treated, GFP cell-treated, or vehicle-treated spinal cord, showing the center of the lesion. Lesion cavity was determined by negative GFAP staining and outlined (dotted lines). b Quantitative analysis of lesion volume showed a significant reduction in the BDNF-GFP cell group compared with the vehicle-treated group (p = 0.007), but not in the GFP group compared with the vehicle-treated group (p = 0.509). The average of n = 4 mice ± SEM is presented with **p <0.01, Kruskal–Wallis test with Dunn’s post-hoc test. BDNF brain-derived neurotrophic factor, GFAP glial fibrillary acidic protein, GFP green fluorescent protein
