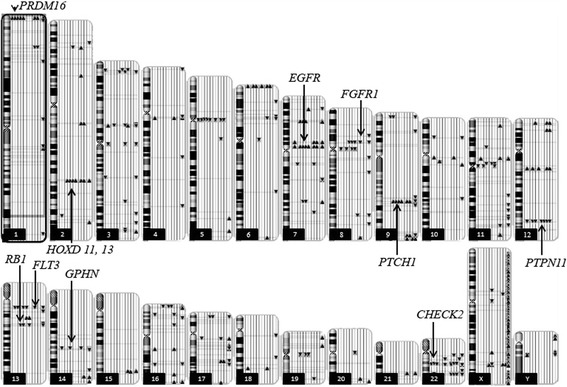
Fig. 1.

Ideogram illustrating genome-wide distribution of DNA amplifications and deletions (copy number variation) on each chromosome. Each line next to the chromosome represents one sample. Gains in copy number are represented by triangles pointing upwards and losses in copy number are represented by triangles pointing downwards with indication of gene in that region. Chromosome numbers are indicated in boxes
