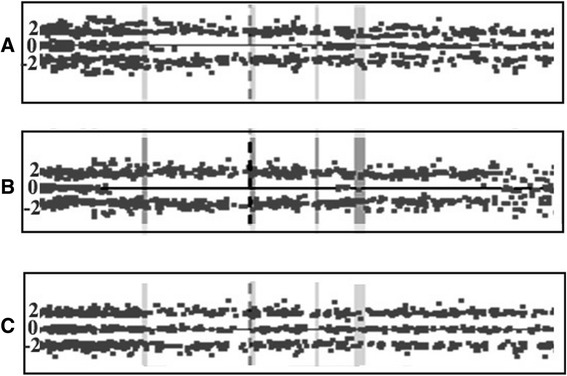
Fig. 2.

CHECK2 copy number state. CHECK2 locus is labeled by centrally located data track with dashed line. The data point scores form a trinomial distribution about the values 2, 0 and −2, where values around 0 represent heterozygous SNPs, while homozygous SNPs have a value of approximately 2 or −2. LOH is located on genomic region with a scarcity of heterozygous SNP calls. a Sample 6 and (b) Sample 13 exhibit LOH of CHECK2 region, (c) The control sample exhibits normal copy number state
