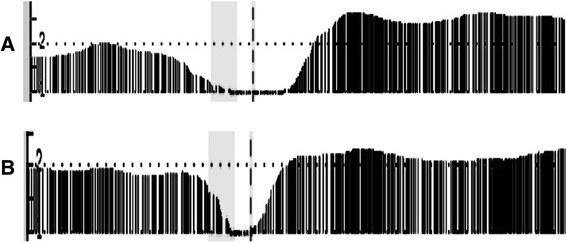
Fig. 3.

VHL locus (Ch.3 p25.3) deletion data display. The smooth signal derived from the raw data is displayed. The smooth signal value is calculated using the intensity values of the flanking probes and the data is displayed by a continuous line which is filled down to the x axis. Focusing on VHL locus was done by selecting the specific region of the chromosome and zooming in such that this region spans the entire x-axis. The data points containing the probe values are overlaid on the graph. Smooth signal value can be between zero or four depending on the Log(2) ratio raw values of the surrounding probes. a Sample 7 and (b) Sample ten smooth signal is one exhibiting deletion in VHL locus (labeled with dashed line). Probes around the area are normal (around 2)
