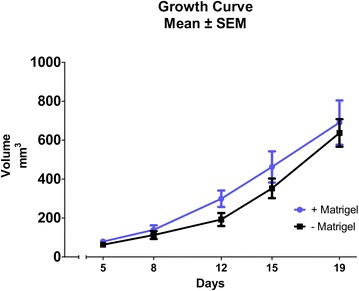
Fig. 1.

Tumor growth curve based on 18F-FDG PET/CT. Tumor volume obtained by drawing region of interest (ROI) enclosing tumor on PET/CT images. No significant difference was found between groups at any time point. All data was obtained from 18F-FDG PET/CT. Days are counted from the day of inoculation (Day 0)
