
Fig. 2.
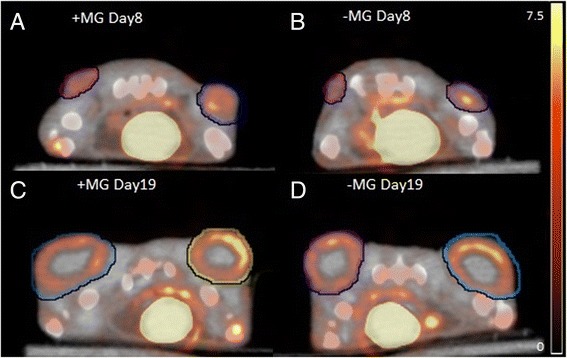
Transverse section of an 18F-FDG PET/CT image of mice with subcutaneous FaDu tumors. 18F-FDG PET/CT scans 1 h after 18F-FDG injection. Region of interests encapsulate tumor on each side of the flank. a and c +MG mouse at scan day 8 and 19, respectively. b and d −MG mouse scan day 8 and 19, respectively. Scale bar is indicated in %ID/g for all images calculated from a specific mass of 1 g/cm3. Scan day represents number of days after inoculation