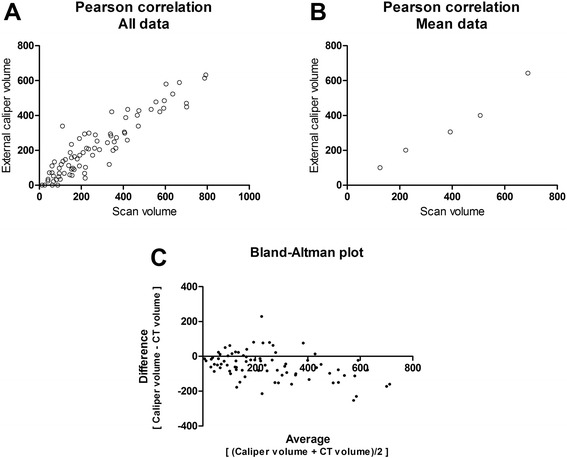
Fig. 4.

Pearson correlation model for 18F-FDG PET/CT determined tumor volume and external caliper determined tumor volume. Correlation between external caliper determined volumes and volumes determined from PET/CT scans. Pearson correlation model was used for the plotted values. a All scans. Correlation coefficient was 0.85 (p-value < 0.0001). b Same regression model with mean value at each time point (5, 8, 12, 15, and 19). Correlation coefficient was 0.98 (p-value = 0.0017). c Bland-Altman plot showing the difference between measurements against the average to visualize bias between methods
