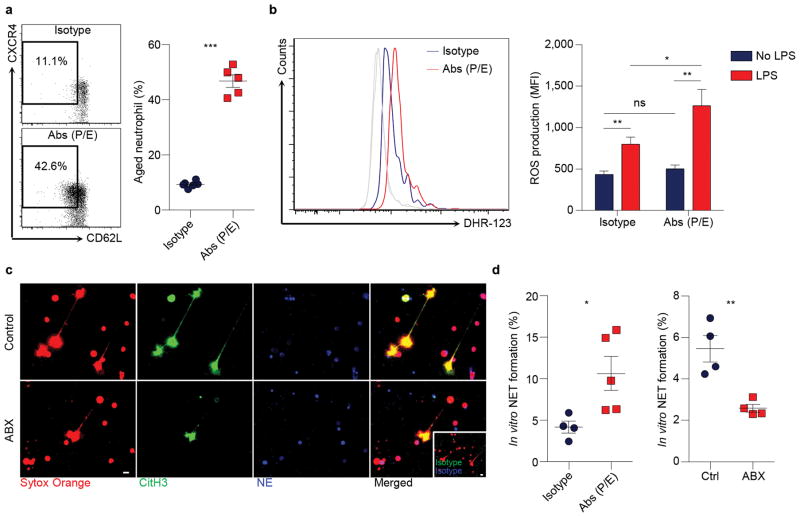
Extended Data Figure 6. Microbiota depletion inhibits NET formation.
a, Flow cytometry analysis of aged neutrophils in isotype and anti-P/E-selectin antibody-treated mice (n = 6,5 mice). b, ROS production of neutrophils from isotype and anti-P/E-selectin antibody-treated mice, as analysed by flow cytometry using Dihydrorhodamine 123 (DHR-123; Isotype: n = 10; Abs (P/E): n = 11 mice). Grey lines, background fluorescence of neutrophils from both groups without LPS stimulation. c, LPS-induced NET formation of neutrophils from control and antibiotics (ABX)-treated mice, as analysed by immunofluorescence staining of DNA (sytox orange), neutrophil elastase (NE) and citrullinated histone 3 (CitH3). Inset, isotype control. Scale bars, 10 μm. d, Quantification of NET formation of neutrophils from isotype and anti-P/E-selectin antibody-treated mice, or from control and ABX-treated mice (left, n = 4,5 mice; right, n = 4 mice). Error bars, mean ± s.e.m. * P < 0.05, ** P < 0.01, *** P < 0.001, data representing ≥2 independent experiments analysed with unpaired Student’s t-test.

