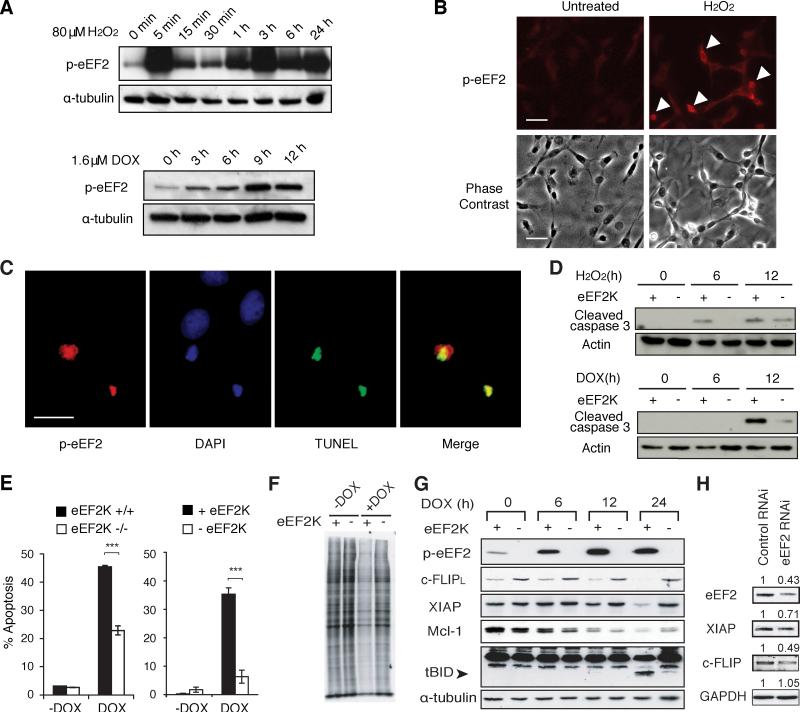
Figure 5. eEF2K is activated during apoptosis and regulates it through downregulation of short-lived anti-apoptotic proteins.
(A) Western blot analysis of p-eEF2 levels in H2O2-treated NIH-3T3 cells or doxorubicin (DOX)-treated MEFs.
(B) Immunostaining of p-eEF2 in NIH3T3 cells exposed to 400 μM H2O2 for 3h compared to untreated cells. Scale bars represent 20 μm.
(C) Immunofluorescent staining in HeLa cells treated with 1μM doxorubicin for 18h; p-eEF2, DAPI and TUNEL staining are shown. Scale bars represent 10 μm.
(D) Analyzed of cleaved caspase-3 levels by Western blot in H2O2 and doxorubicin-treated knockout MEFs expressing vector alone (−eEF2K) or vector containing eEF2K cDNA (+eEF2K). (E) Apoptosis analyzed by TUNEL assay in H2O2 and doxorubicin-treated wild-type (eEF2K+/+), knockout (eEF2K−/−), and knockout MEFs expressing vector alone (−eEF2K) or vector containing eEF2K cDNA (+eEF2K). Data are represented as mean +/− S.E.M. and “ *** “ represents P< 0.002 (two-tailed T-test).
(F) Measurement of protein synthesis in knockout MEFs expressing vector alone (−eEF2K) or vector containing eEF2K cDNA (+eEF2K) treated with doxorubicin for 12h and labeled with 35S-methionine.
(G) Western blot analysis of p-eEF2, c-FLIPL, XIAP, Mcl-1, tBID and α-tubulin in doxorubicin-treated MEFs expressing vector alone (−eEF2K) or vector containing eEF2K cDNA (+eEF2K).
(H) Western blot analysis of eEF2, XIAP, c-FLIPL, and GAPDH in eEF2 knockdown MEFs. Refer also to Figure S5.

