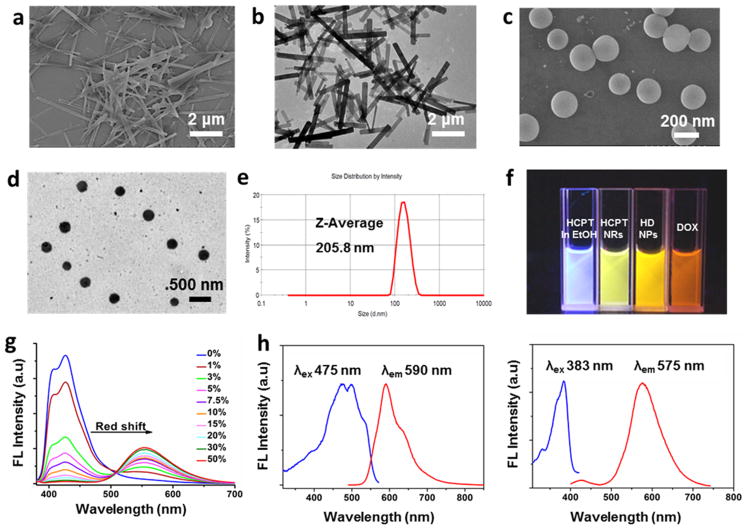
Figure 1.
(a) SEM image of HCPT nanorods (NRs). (b) TEM image of HCPT NRs. (c) SEM image of HD NPs. (d) TEM image of HD NPs. (e) Size distribution of HD NPs with polydispersity index (PDI) = 0.264. (f) Fluorescence image of HCPT in ethanol, HCPT NRs in 90% water/10% ethanol, HD NPs in aqueous solution, and DOX in aqueous solution. (g) Emission spectra of HCPT in ethanol/water solution with ratios of water to ethanol from 0 to 50%. (h) Fluorescence spectra of HD NPs (20 μM DOX and 5 μM HCPT). Left: λex (HCPT) = 383 nm. Right: λex (DOX) = 475 nm.

