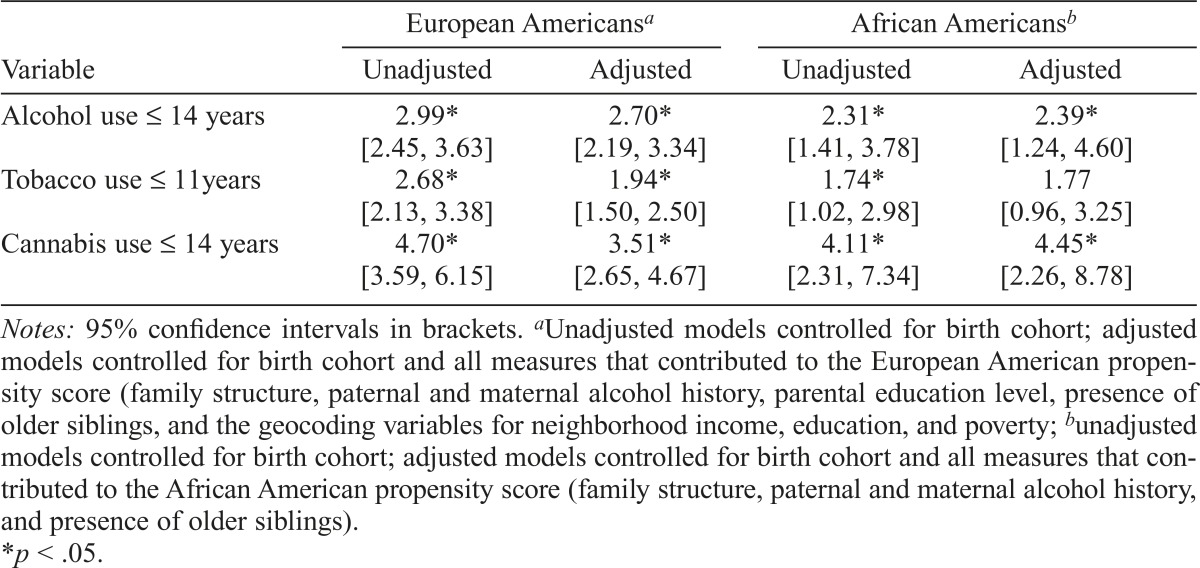
Table 2.
Unadjusted and adjusted odds ratios from logistic regression analyses predicting early substance initiation from twin-reported low parental monitoring (lowest quartile, compared with higher 75%) in European American and African American twin pairs
| Variable | European Americansa |
African Americansb |
||
| Unadjusted | Adjusted | Unadjusted | Adjusted | |
| Alcohol use ≤ 14 years | 2.99* | 2.70* | 2.31* | 2.39* |
| [2.45, 3.63] | [2.19, 3.34] | [1.41, 3.78] | [1.24, 4.60] | |
| Tobacco use ≤ 11years | 2.68* | 1.94* | 1.74* | 1.77 |
| [2.13, 3.38] | [1.50, 2.50] | [1.02, 2.98] | [0.96, 3.25] | |
| Cannabis use ≤ 14 years | 4.70* | 3.51* | 4.11* | 4.45* |
| [3.59, 6.15] | [2.65, 4.67] | [2.31, 7.34] | [2.26, 8.78] | |
Notes: 95% confidence intervals in brackets.
Unadjusted models controlled for birth cohort; adjusted models controlled for birth cohort and all measures that contributed to the European American propensity score (family structure, paternal and maternal alcohol history, parental education level, presence of older siblings, and the geocoding variables for neighborhood income, education, and poverty;
unadjusted models controlled for birth cohort; adjusted models controlled for birth cohort and all measures that contributed to the African American propensity score (family structure, paternal and maternal alcohol history, and presence of older siblings).
p < .05.

