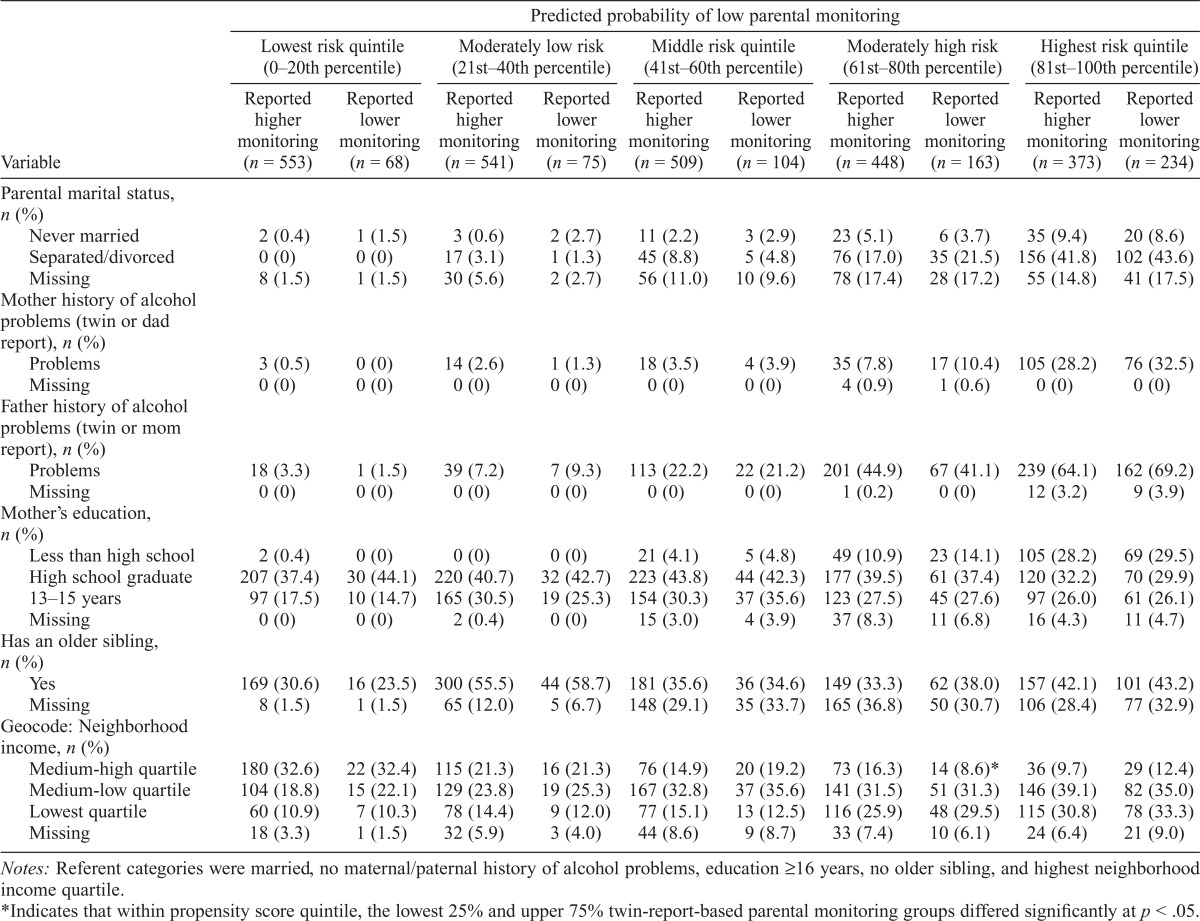
Table 3.
Family and neighborhood (geocoding) predictors of twin-reported parental monitoring in European American families, by predicted parental monitoring quintile
| Predicted probability of low parental monitoring
|
||||||||||
| Lowest risk quintile (0-20th
percentile) |
Moderately low risk (21st-40th
percentile) |
Middle risk quintile (41st-60th
percentile) |
Moderately high risk (61st-80th
percentile) |
Highest risk quintile (81st-100th
percentile) |
||||||
| Variable | Reported higher monitoring (n = 553) | ReportedLower monitoring (n = 68) | Reported higher monitoring (n = 541) | Reported lower monitoring (n = 75) | Reported Higher monitoring (n = 509) | Reported Lower monitoring (n = 104) | Reported Higher monitoring (n = 448) | Reported lower monitoring (n = 163) | Reported Higher monitoring (n = 373) | Reported lower monitoring (n = 234) |
| Parental marital status, n (%) | ||||||||||
| Never married | 2 (0.4) | 1 (1.5) | 3 (0.6) | 2 (2.7) | 11 (2.2) | 3 (2.9) | 23 (5.1) | 6 (3.7) | 35 (9.4) | 20 (8.6) |
| Separated/divorced | 0 (0) | 0 (0) | 17(3.1) | 1(1.3) | 45 (8.8) | 5 (4.8) | 76 (17.0) | 35 (21.5) | 156(41.8) | 102 (43.6) |
| Missing | 8(1.5) | 1 (1.5) | 30 (5.6) | 2 (2.7) | 56 (11.0) | 10 (9.6) | 78 (17.4) | 28 (17.2) | 55 (14.8) | 41 (17.5) |
| Mother history of alcohol problems (twin or dad report), n (%) | ||||||||||
| Problems | 3 (0.5) | 0 (0) | 14(2.6) | 1(1.3) | 18 (3.5) | 4 (3.9) | 35 (7.8) | 17 (10.4) | 105 (28.2) | 76 (32.5) |
| Missing | 0 (0) | 0 (0) | 0 (0) | 0 (0) | 0 (0) | 0 (0) | 4 (0.9) | 1 (0.6) | 0 (0) | 0(0) |
| Father history of alcohol problems (twin or mom report), n (%) | ||||||||||
| Problems | 18 (3.3) | 1 (1.5) | 39 (7.2) | 7 (9.3) | 113 (22.2) | 22 (21.2) | 201 (44.9) | 67 (41.1) | 239(64.1) | 162 (69.2) |
| Missing | 0 (0) | 0 (0) | 0 (0) | 0 (0) | 0 (0) | 0 (0) | 1 (0.2) | 0 (0) | 12(3.2) | 9 (3.9) |
| Mother’s education, n (%) | ||||||||||
| Less than high school | 2 (0.4) | 0 (0) | 0 (0) | 0 (0) | 21 (4.1) | 5 (4.8) | 49 (10.9) | 23 (14.1) | 105 (28.2) | 69 (29.5) |
| High school graduate | 207 (37.4) | 30 (44.1) | 220 (40.7) | 32 (42.7) | 223 (43.8) | 44 (42.3) | 177 (39.5) | 61 (37.4) | 120 (32.2) | 70 (29.9) |
| 13-15 years | 97 (17.5) | 10 (14.7) | 165 (30.5) | 19 (25.3) | 154 (30.3) | 37 (35.6) | 123 (27.5) | 45 (27.6) | 97 (26.0) | 61 (26.1) |
| Missing | 0 (0) | 0(0) | 2 (0.4) | 0 (0) | 15 (3.0) | 4 (3.9) | 37 (8.3) | 11 (6.8) | 16(4.3) | 11 (4.7) |
| Has an older sibling, n (%) | ||||||||||
| Yes | 169 (30.6) | 16 (23.5) | 300 (55.5) | 44 (58.7) | 181 (35.6) | 36 (34.6) | 149 (33.3) | 62 (38.0) | 157(42.1) | 101 (43.2) |
| Missing | 8(1.5) | 1 (1.5) | 65 (12.0) | 5 (6.7) | 148 (29.1) | 35 (33.7) | 165 (36.8) | 50 (30.7) | 106 (28.4) | 77 (32.9) |
| Geocode: Neighborhood income, n (%) | ||||||||||
| Medium-high quartile | 180 (32.6) | 22 (32.4) | 115 (21.3) | 16 (21.3) | 76 (14.9) | 20 (19.2) | 73 (16.3) | 14 (8.6)* | 36 (9.7) | 29 (12.4) |
| Medium-low quartile | 104(18.8) | 15 (22.1) | 129 (23.8) | 19 (25.3) | 167 (32.8) | 37 (35.6) | 141 (31.5) | 51 (31.3) | 146(39.1) | 82 (35.0) |
| Lowest quartile | 60 (10.9) | 7 (10.3) | 78 (14.4) | 9 (12.0) | 77 (15.1) | 13 (12.5) | 116 (25.9) | 48 (29.5) | 115 (30.8) | 78 (33.3) |
| Missing | 18 (3.3) | 1 (1.5) | 32 (5.9) | 3 (4.0) | 44 (8.6) | 9 (8.7) | 33 (7.4) | 10 (6.1) | 24 (6.4) | 21 (9.0) |
Notes: Referent categories were married, no maternal/paternal history of alcohol problems, education ≥16 years, no older sibling, and highest neighborhood income quartile.
Indicates that within propensity score quintile, the lowest 25% and upper 75% twin-report-based parental monitoring groups differed significantly at p < .05.

