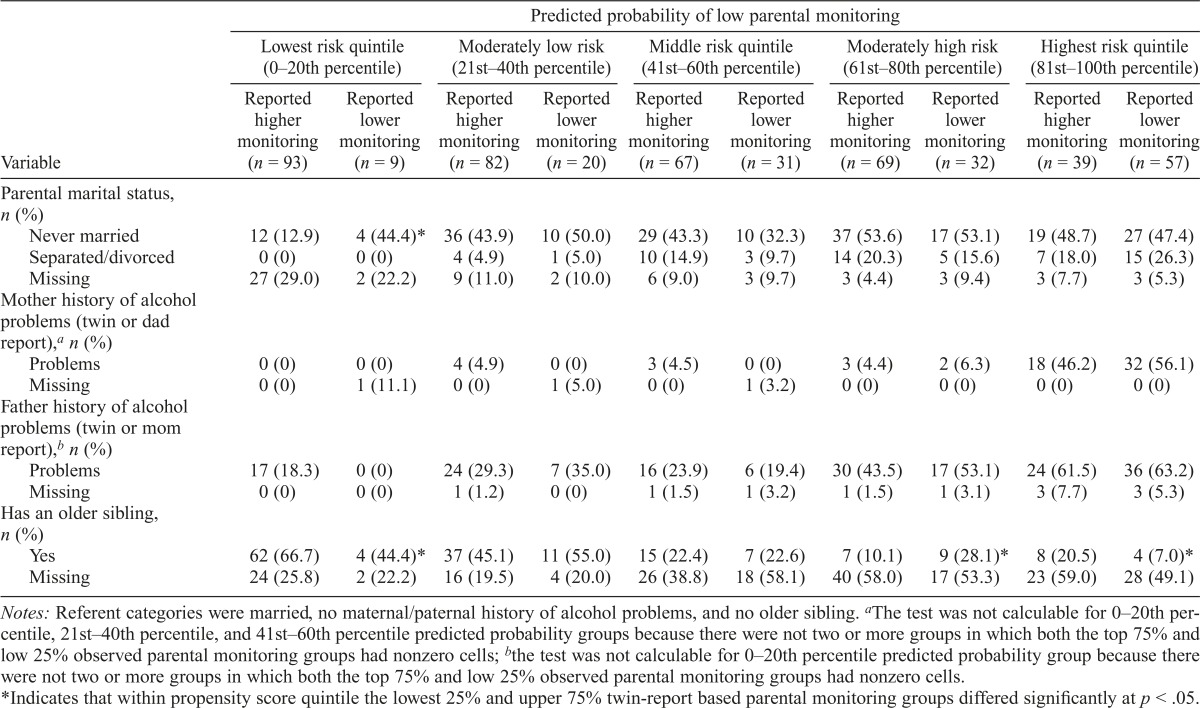
Table 4.
Representative family predictors of twin-reported parental monitoring in African American families, by predicted parental monitoring quintile
| Predicted probability of low parental
monitoring |
||||||||||
| Lowest risk quintile (0-20th
percentile) |
Moderately low risk (21st-40th
percentile) |
Middle risk quintile (41st-60th
percentile) |
Moderately high risk (61st-80th
percentile) |
Highest risk quintile (81st-100th
percentile) |
||||||
| Variable | Reported Higher monitoring (n = 93) | Reported Lower monitoring (n = 9) | Reported higher monitoring (n = 82) | Reported Lower monitoring (n = 20) | Reported higher monitoring (n = 67) | Reported lower monitoring (n = 31) | Reported higher monitoring (n = 69) | Reported lower monitoring (n = 32) | Reported higher monitoring (n = 39) | Reported lower monitoring (n = 57) |
| Parental marital status, n (%) | ||||||||||
| Never married | 12 (12.9) | 4(44.4)* | 36 (43.9) | 10 (50.0) | 29 (43.3) | 10 (32.3) | 37 (53.6) | 17(53.1) | 19 (48.7) | 27 (47.4) |
| Separated/divorced | 0 (0) | 0(0) | 4 (4.9) | 1 (5.0) | 10 (14.9) | 3 (9.7) | 14 (20.3) | 5(15.6) | 7 (18.0) | 15 (26.3) |
| Missing | 27 (29.0) | 2 (22.2) | 9 (11.0) | 2 (10.0) | 6 (9.0) | 3 (9.7) | 3 (4.4) | 3 (9.4) | 3 (7.7) | 3 (5.3) |
| Mother history of alcohol problems (twin or dad report),a n (%) | ||||||||||
| Problems | 0 (0) | 0 (0) | 4 (4.9) | 0 (0) | 3 (4.5) | 0 (0) | 3 (4.4) | 2(6.3) | 18 (46.2) | 32 (56.1) |
| Missing | 0 (0) | 1(11.1) | 0(0) | 1 (5.0) | 0(0) | 1 (3.2) | 0(0) | 0 (0) | 0(0) | 0 (0) |
| Father history of alcohol problems (twin or mom report),b n (%) | ||||||||||
| Problems | 17 (18.3) | 0 (0) | 24 (29.3) | 7 (35.0) | 16 (23.9) | 6 (19.4) | 30 (43.5) | 17(53.1) | 24 (61.5) | 36 (63.2) |
| Missing | 0 (0) | 0 (0) | 1 (1.2) | 0 (0) | 1(1.5) | 1 (3.2) | 1 (1.5) | 1(3.1) | 3 (7.7) | 3 (5.3) |
| Has an older sibling, n (%) | ||||||||||
| Yes | 62 (66.7) | 4(44.4)* | 37 (45.1) | 11 (55.0) | 15 (22.4) | 7 (22.6) | 7 (10.1) | 9 (28.1)* | 8 (20.5) | 4 (7.0)* |
| Missing | 24 (25.8) | 2 (22.2) | 16 (19.5) | 4 (20.0) | 26 (38.8) | 18 (58.1) | 40 (58.0) | 17(53.3) | 23 (59.0) | 28 (49.1) |
Notes: Referent categories were married, no maternal/paternal history of alcohol problems, and no older sibling.
The test was not calculable for 0–20th percentile, 21st–40th percentile, and 41st–60th percentile predicted probability groups because there were not two or more groups in which both the top 75% and low 25% observed parental monitoring groups had nonzero cells;
the test was not calculable for 0–20th percentile predicted probability group because there were not two or more groups in which both the top 75% and low 25% observed parental monitoring groups had nonzero cells.
Indicates that within propensity score quintile the lowest 25% and upper 75% twin-report based parental monitoring groups differed significantly at p < .05.

