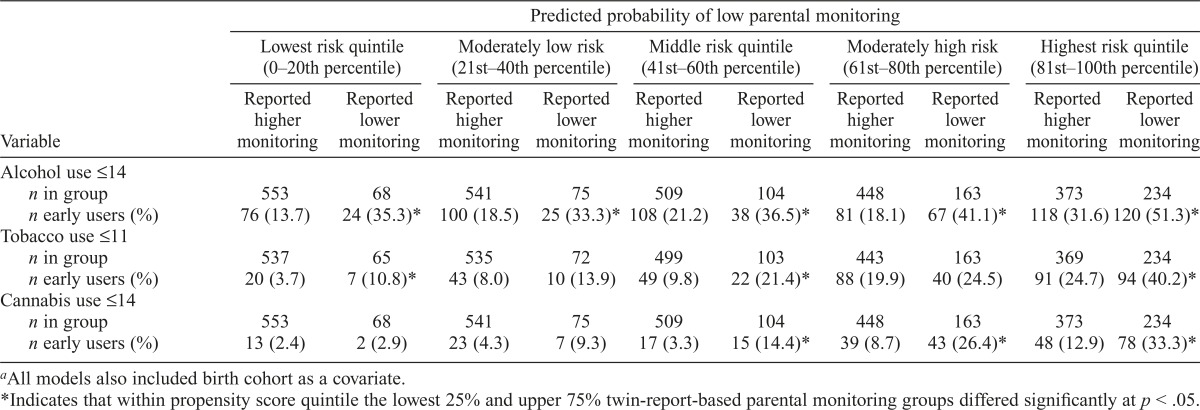
Table 5.
Prevalence of early substance involvement in European American twins from twin-reported low and higher parental monitoring families, by predicted parental monitoring quintilea
| Predicted probability of low parental
monitoring |
||||||||||
| Lowest risk quintile (0-20th
percentile) |
Moderately low risk (21st–40th
percentile) |
Middle risk quintile (41st-60th
percentile) |
Moderately high risk (61st-80th
percentile) |
Highest risk quintile (81st-100th
percentile) |
||||||
| Variable | Reported higher monitoring | Reported lower monitoring | Reported higher monitoring | Reported lower monitoring | Reported higher monitoring | Reported lower monitoring | Reported higher monitoring | Reported lower monitoring | Reported higher monitoring | Reported lower monitoring |
| Alcohol use ≤14 | ||||||||||
| n in group | 553 | 68 | 541 | 75 | 509 | 104 | 448 | 163 | 373 | 234 |
| n early users (%) | 76 (13.7) | 24 (35.3)* | 100 (18.5) | 25 (33.3)* | 108 (21.2) | 38 (36.5)* | 81 (18.1) | 67 (41.1)* | 118 (31.6) 120 (51.3)* | |
| Tobacco use ≤11 | ||||||||||
| n in group | 537 | 65 | 535 | 72 | 499 | 103 | 443 | 163 | 369 | 234 |
| n early users (%) | 20 (3.7) | 7 (10.8)* | 43 (8.0) | 10(13.9) | 49 (9.8) | 22 (21.4)* | 88 (19.9) | 40 (24.5) | 91 (24.7) | 94 (40.2)* |
| Cannabis use ≤14 | ||||||||||
| n in group | 553 | 68 | 541 | 75 | 509 | 104 | 448 | 163 | 373 | 234 |
| n early users (%) | 13 (2.4) | 2 (2.9) | 23 (4.3) | 7 (9.3) | 17 (3.3) | 15 (14.4)* | 39 (8.7) | 43 (26.4)* | 48(12.9) | 78 (33.3)* |
All models also included birth cohort as a covariate.
Indicates that within propensity score quintile the lowest 25% and upper 75% twin-report-based parental monitoring groups differed significantly at p < .05.

