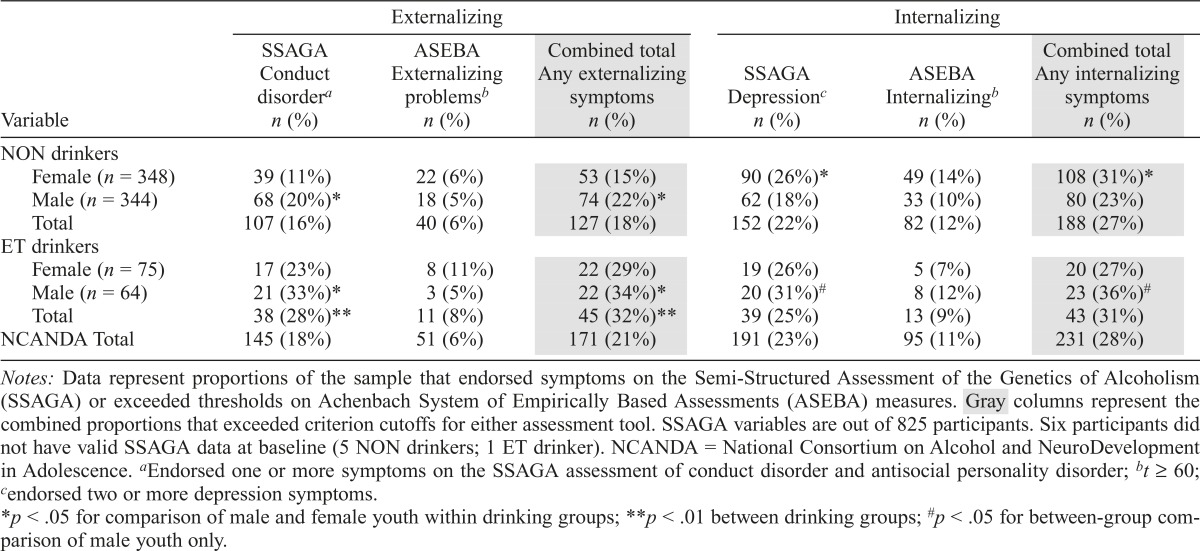
Table 6.
Internalizing and externalizing disorder symptom endorsement on NCANDA sample for non-/low (NON; n = 692) drinkers and drinkers who exceeded thresholds (ET; n = 139) at baseline
| Variable | Externalizing |
Internalizing |
||||
| SSAGA Conduct disordera n (%) | ASEBA Externalizing problemsb n (%) | Combined total Any externalizing symptoms n (%) | SSAGA Depressionc n (%) | ASEBA Internalizingb n (%) | Combined total Any internalizing symptoms n (%) | |
| NON drinkers | ||||||
| Female (n = 348) | 39 (11%) | 22 (6%) | 53 (15%) | 90 (26%)* | 49 (14%) | 108(31%)* |
| Male (n = 344) | 68 (20%)* | 18(5%) | 74 (22%)* | 62(18%) | 33 (10%) | 80 (23%) |
| Total | 107 (16%) | 40 (6%) | 127 (18%) | 152(22%) | 82 (12%) | 188(27%) |
| ET drinkers | ||||||
| Female (n = 75) | 17 (23%) | 8(11%) | 22 (29%) | 19 (26%) | 5 (7%) | 20 (27%) |
| Male (n = 64) | 21 (33%)* | 3 (5%) | 22 (34%)* | 20(31%)# | 8 (12%) | 23 (36%)# |
| Total | 38 (28%)** | 11 (8%) | 45 (32%)** | 39 (25%) | 13 (9%) | 43 (31%) |
| NCANDA Total | 145 (18%) | 51 (6%) | 171 (21%) | 191 (23%) | 95 (11%) | 231 (28%) |
Notes: Data represent proportions of the sample that endorsed symptoms on the Semi-Structured Assessment of the Genetics of Alcoholism (SSAGA) or exceeded thresholds on Achenbach System of Empirically Based Assessments (ASEBA) measures. Gray columns represent the combined proportions that exceeded criterion cutoffs for either assessment tool. SSAGA variables are out of 825 participants. Six participants did not have valid SSAGA data at baseline (5 NON drinkers; 1 ET drinker). NCANDA = National Consortium on Alcohol and NeuroDevelopment in Adolescence.
Endorsed one or more symptoms on the SSAGA assessment of conduct disorder and antisocial personality disorder;
t ≥ 60;
Endorsed two or more depression symptoms.
p < .05 for comparison of male and female youth within drinking groups;
p < .01 between drinking groups;
p < .05 for between-group comparison of male youth only.

