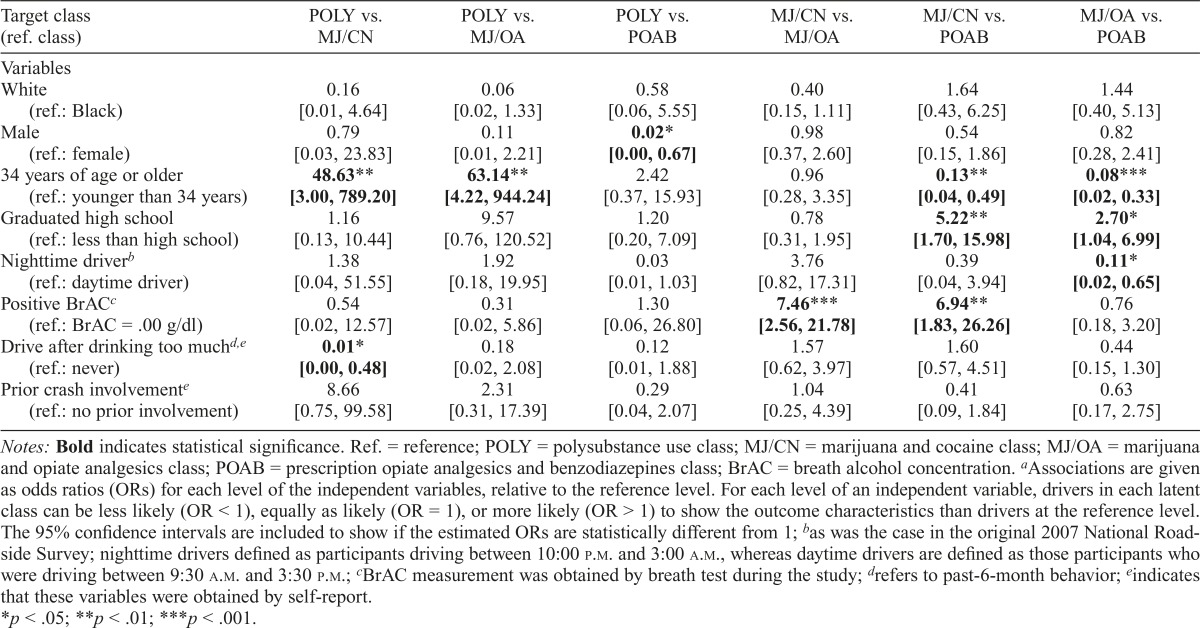
Table 3.
Associationsa between latent class membership and demographic and driving characteristics in a sample of 250 active motor vehicle operators
| Target class (ref. class) | POLY vs. MJ/CN | POLY vs. MJ/OA | POLY vs. POAB | MJ/CN vs. MJ/OA | MJ/CN vs. POAB | MJ/OA vs. POAB |
| Variables | ||||||
| White | 0.16 | 0.06 | 0.58 | 0.40 | 1.64 | 1.44 |
| (ref.: Black) | [0.01, 4.64] | [0.02, 1.33] | [0.06, 5.55] | [0.15, 1.11] | [0.43, 6.25] | [0.40, 5.13] |
| Male | 0.79 | 0.11 | 0.02* | 0.98 | 0.54 | 0.82 |
| (ref.: female) | [0.03, 23.83] | [0.01, 2.21] | [0.00, 0.67] | [0.37, 2.60] | [0.15, 1.86] | [0.28, 2.41] |
| 34 years of age or older | 48.63** | 63.14** | 2.42 | 0.96 | 0.13** | 0.08*** |
| (ref.: younger than 34 years) | [3.00, 789.20] | [4.22, 944.24] | [0.37, 15.93] | [0.28, 3.35] | [0.04, 0.49] | [0.02, 0.33] |
| Graduated high school | 1.16 | 9.57 | 1.20 | 0.78 | 5.22** | 2.70* |
| (ref.: less than high school) | [0.13, 10.44] | [0.76, 120.52] | [0.20, 7.09] | [0.31, 1.95] | [1.70, 15.98] | [1.04, 6.99] |
| Nighttime driverb | 1.38 | 1.92 | 0.03 | 3.76 | 0.39 | 0.11* |
| (ref.: daytime driver) | [0.04, 51.55] | [0.18, 19.95] | [0.01, 1.03] | [0.82, 17.31] | [0.04, 3.94] | [0.02, 0.65] |
| Positive BrAC | 0.54 | 0.31 | 1.30 | 7.46*** | 6.94** | 0.76 |
| (ref.: BrAC = .00 g/dl) | [0.02, 12.57] | [0.02, 5.86] | [0.06, 26.80] | [2.56, 21.78] | [1.83, 26.26] | [0.18, 3.20] |
| Drive after drinking too muchd,e | 0.01* | 0.18 | 0.12 | 1.57 | 1.60 | 0.44 |
| (ref.: never) | [0.00, 0.48] | [0.02, 2.08] | [0.01, 1.88] | [0.62, 3.97] | [0.57, 4.51] | [0.15, 1.30] |
| Prior crash involvementc | 8.66 | 2.31 | 0.29 | 1.04 | 0.41 | 0.63 |
| (ref.: no prior involvement) | [0.75, 99.58] | [0.31, 17.39] | [0.04, 2.07] | [0.25, 4.39] | [0.09, 1.84] | [0.17, 2.75] |
Notes: Bold indicates statistical significance. Ref. = reference; POLY = polysubstance use class; MJ/CN = marijuana and cocaine class; MJ/OA = marijuana and opiate analgesics class; POAB = prescription opiate analgesics and benzodiazepines class; BrAC = breath alcohol concentration.
Associations are given as odds ratios (ORs) for each level of the independent variables, relative to the reference level. For each level of an independent variable, drivers in each latent class can be less likely (OR < 1), equally as likely (OR = 1), or more likely (OR > 1) to show the outcome characteristics than drivers at the reference level. The 95% confidence intervals are included to show if the estimated ORs are statistically different from 1;
as was the case in the original 2007 National Roadside Survey; nighttime drivers defined as participants driving between 10:00 p.m. and 3:00 a.m., whereas daytime drivers are defined as those participants who were driving between 9:30 a.m. and 3:30 p.m.;
BrAC measurement was obtained by breath test during the study;
refers to past-6-month behavior;
indicates that these variables were obtained by self-report.
p < .05;
p < .01;
p < .001.

