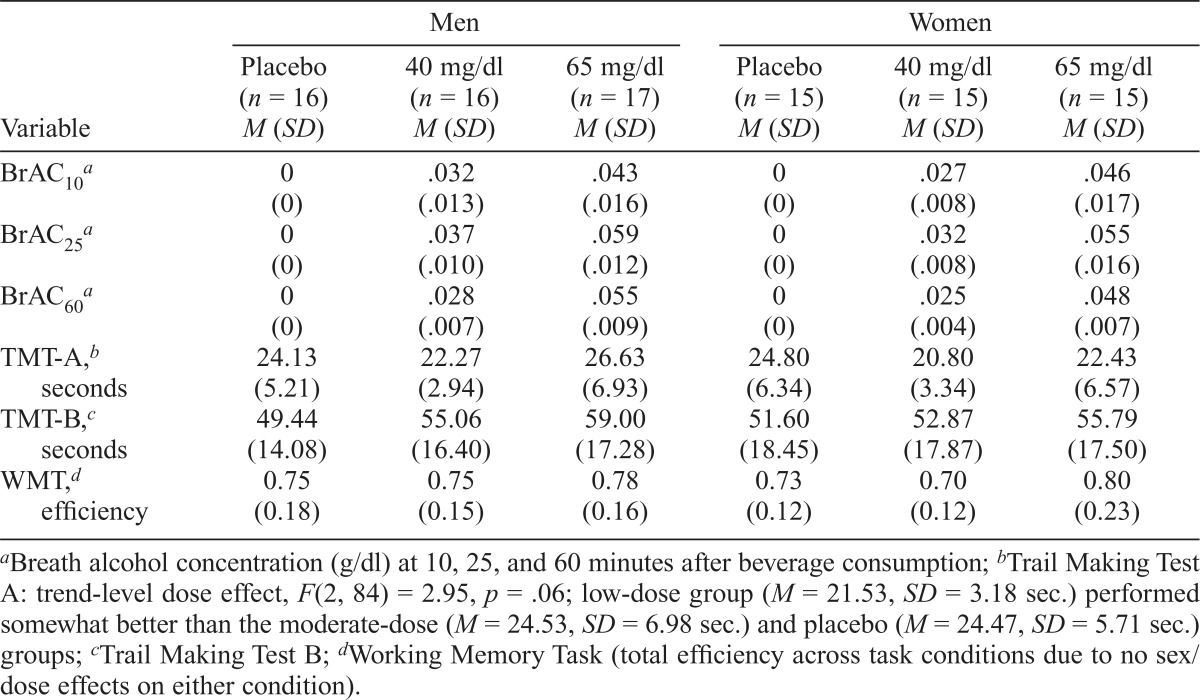
Table 1.
Breath alcohol concentrations (BrAC) and task performance
| Men |
Women |
|||||
| Variable | Placebo (n = 16) M (SD) | 40 mg/dl (n = 16) M (SD) | 65 mg/dl (n = 17) M (SD) | Placebo (n = 15) M (SD) | 40 mg/dl (n = 15) M (SD) | 65 mg/dl (n = 15) M (SD) |
| BrAC10a | 0 (0) | .032 (.013) | .043 (.016) | 0 (0) | .027 (.008) | .046 (.017) |
| BrAC25a | 0 (0) | .037 (.010) | .059 (.012) | 0 (0) | .032 (.008) | .055 (.016) |
| BrAC60a | 0 (0) | .028 (.007) | .055 (.009) | 0 (0) | .025 (.004) | .048 (.007) |
| tmt-a,b seconds | 24.13 (5.21) | 22.27 (2.94) | 26.63 (6.93) | 24.80 (6.34) | 20.80 (3.34) | 22.43 (6.57) |
| tmt-b,c seconds | 49.44 (14.08) | 55.06 (16.40) | 59.00 (17.28) | 51.60 (18.45) | 52.87 (17.87) | 55.79 (17.50) |
| WMT,d efficiency | 0.75 (0.18) | 0.75 (0.15) | 0.78 (0.16) | 0.73 (0.12) | 0.70 (0.12) | 0.80 (0.23) |
Breath alcohol concentration (g/dl) at 10, 25, and 60 minutes after beverage consumption;
Trail Making Test A: trend-level dose effect, F(2, 84) = 2.95, p = .06; low-dose group (M = 21.53, SD = 3.18 sec.) performed somewhat better than the moderate-dose (M = 24.53, SD = 6.98 sec.) and placebo (M = 24.47, SD = 5.71 sec.) groups;
Trail Making Test B;
Working Memory Task (total efficiency across task conditions due to no sex/dose effects on either condition).

