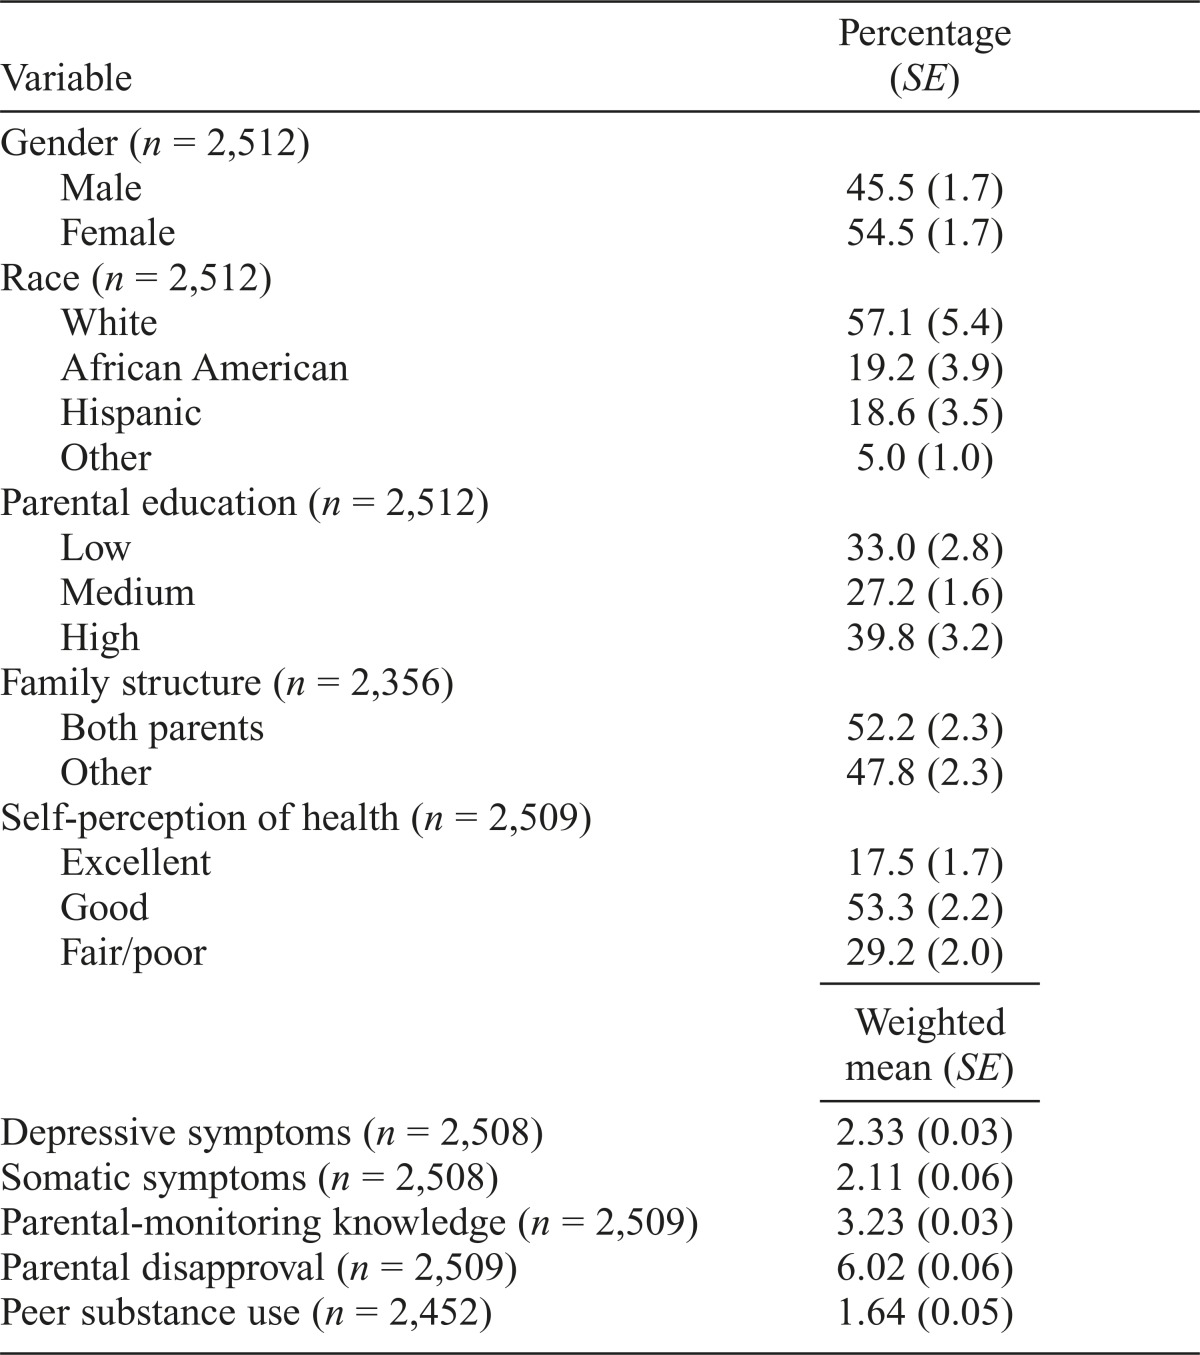
Table 1.
Description of the sample and baseline covariates (N = 2,512)
| Variable | Percentage (SE) |
| Gender (n = 2,512) | |
| Male | 45.5 (1.7) |
| Female | 54.5 (1.7) |
| Race (n = 2,512) | |
| White | 57.1 (5.4) |
| African American | 19.2 (3.9) |
| Hispanic | 18.6 (3.5) |
| Other | 5.0 (1.0) |
| Parental education (n = 2,512) | |
| Low | 33.0 (2.8) |
| Medium | 27.2 (1.6) |
| High | 39.8 (3.2) |
| Family structure (n = 2,356) | |
| Both parents | 52.2 (2.3) |
| Other | 47.8 (2.3) |
| Self-perception of health (n = 2,509) | |
| Excellent | 17.5 (1.7) |
| Good | 53.3 (2.2) |
| Fair/poor | 29.2 (2.0) |
| Weighted mean (SE) | |
| Depressive symptoms (n = 2,508) | 2.33 (0.03) |
| Somatic symptoms (n = 2,508) | 2.11 (0.06) |
| Parental-monitoring knowledge (n = 2,509) | 3.23 (0.03) |
| Parental disapproval (n = 2,509) | 6.02 (0.06) |
| Peer substance use (n = 2,452) | 1.64 (0.05) |

