FIGURE 3.
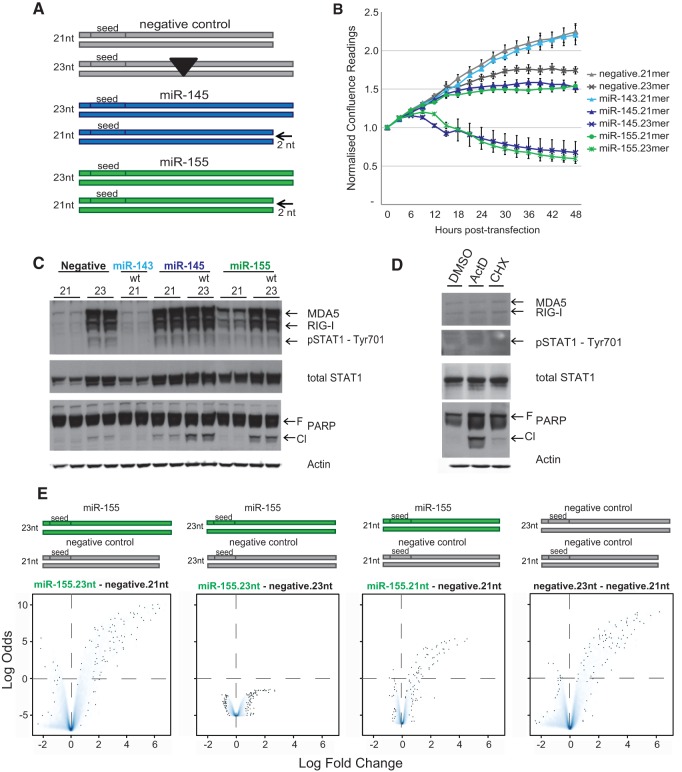
The effect of miR-155 mimic in MCF-7 is length-dependent. (A) Schematic illustration of custom lengthened negative control and shortened miR-145 and miR-155 mimics. Not to scale. (B) Normalized confluence readings collected post-transfection of MCF-7 cells with 10 nM of mimic variants (as in Fig. 1). Error bars, SEM of nine scans per well (n = 2). (C) Western blot analysis of MCF-7 cells matched to B, collected 24 h post-transfection; protein samples were sequentially probed for the dsRNA-response sensors RIG-I and MDA5, interferon-induced phosphorylated STAT1-Tyr701 and total STAT1, apoptosis marker PARP (F: full-length; Cl: cleaved), and actin as a loading control. (D) Western blot analysis of dsRNA-response elements (as in C) in MCF-7 cells collected 24 h post-treatment with apoptosis inducing actinomycin D (10 nM), cyclohexamide (100 nM), or DMSO alone. (E) Volcano density plots (as in Fig. 1) of microarray-based differentially expressed genes of MCF-7 cells transfected the indicated mimic variants. The y-axes are on a common scale.

