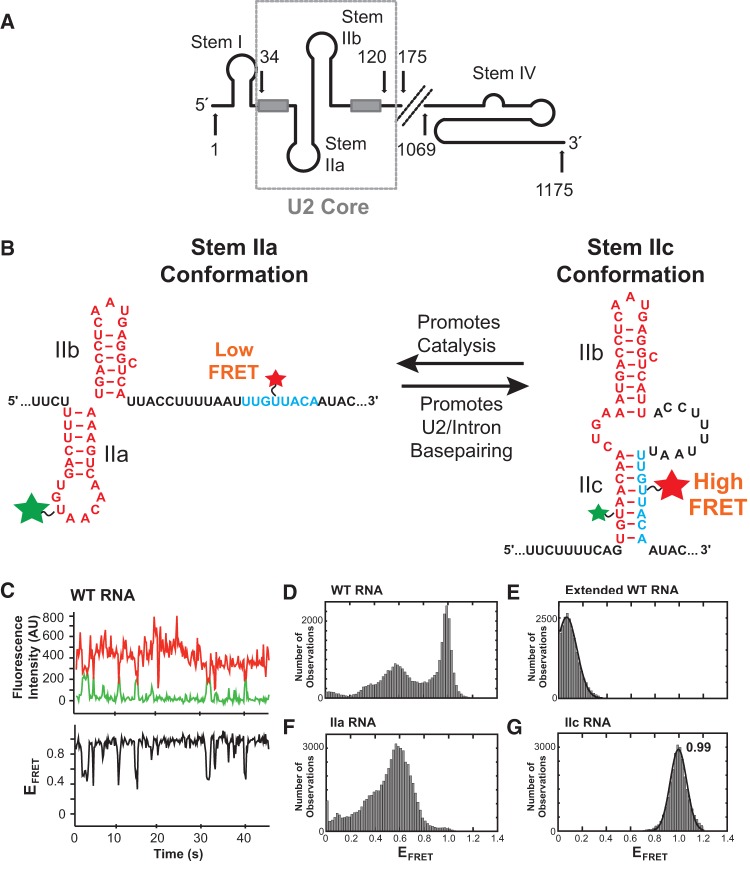
FIGURE 1.
Model RNA design and smFRET data. (A) Model of the yeast U2 snRNA. The U2 core RNA used in smFRET assays (nt 34–120, displayed as stem IIa/b) is boxed. Light gray boxes represent the branch point recognition sequence and Sm protein binding site. (B) Design of a smFRET reporter of stem II conformation. Fluorophores were placed to produce a high FRET signal during stem IIc formation when they come into close proximity. (C, top panel) Example smFRET data from the WT U2 core RNA showing anti-correlated changes in Cy3 donor (green) and Cy5 acceptor (red) fluorescence indicative of FRET. (Bottom panel) Calculated EFRET from the data in the top panel shows fluctuations between mid and high EFRET values. (D) Distribution of EFRET values for the WT U2 core RNA (N = 100 molecules). (E) Distribution of EFRET values after extension by hybridization to a complementary DNA oligo (N = 81). (F) Distribution of EFRET values for a stem IIa RNA (N = 105). (G) Distribution of EFRET values for a stem IIc RNA (N = 72). The data in E and G could be fit by a single Gaussian distribution (black lines) centered at 0.06 and 0.99, respectively.

