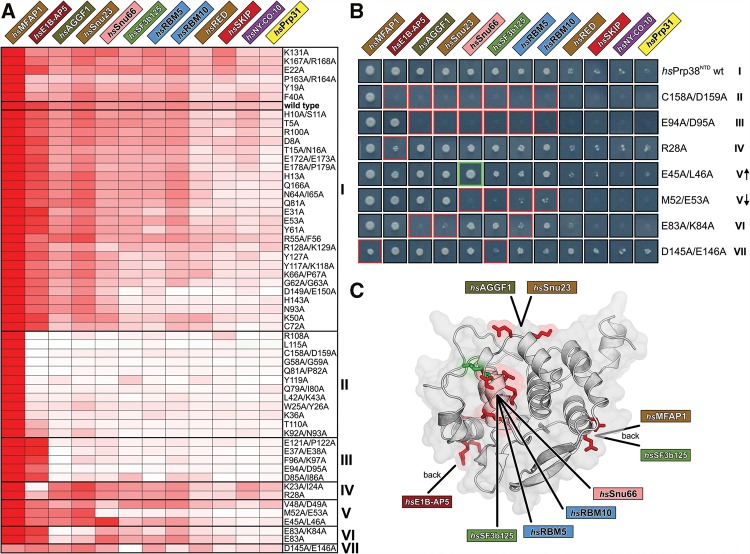
FIGURE 4.
Binding site mapping. (A) Fifty-six single or double alanine variants of hsPrp38NTD are clustered according to the degree of similarity in their effects on the interactions with the 12 identified hsPrp38NTD binding partners (clusters I–VII on the right). As a measure of relative binding strength, the growth signal of Y2H hits was quantified, normalized to the growth signal of the hsPrp38NTD–hsMFAP1 interaction and presented in a heat map by a white-to-red color gradient. White boxes—no growth; red boxes—strong growth. The wt binding profile is boxed in cluster I. (B) Growth of representative Y2H colonies of the 12 hsPrp38NTD binding partners with respective hsPrp38NTD variants of all seven clusters on selective agar (I–VII). Red or green boxes indicate reduction or increase of the growth signal relative to wt hsPrp38NTD, respectively. V↑—subgroup of cluster V with increased interaction to hsSnu66; V↓—subgroup of cluster V with reduced interaction to hsSnu66. (C) Cartoon representation of hsPrp38NTD with clusters IV–VII mapped to the protein surface. Residues mutated in clusters IV–VII that negatively affect binding of an interaction partner are colored in red; the residue that upon mutation positively affects binding of hsSnu66 is colored in green.

