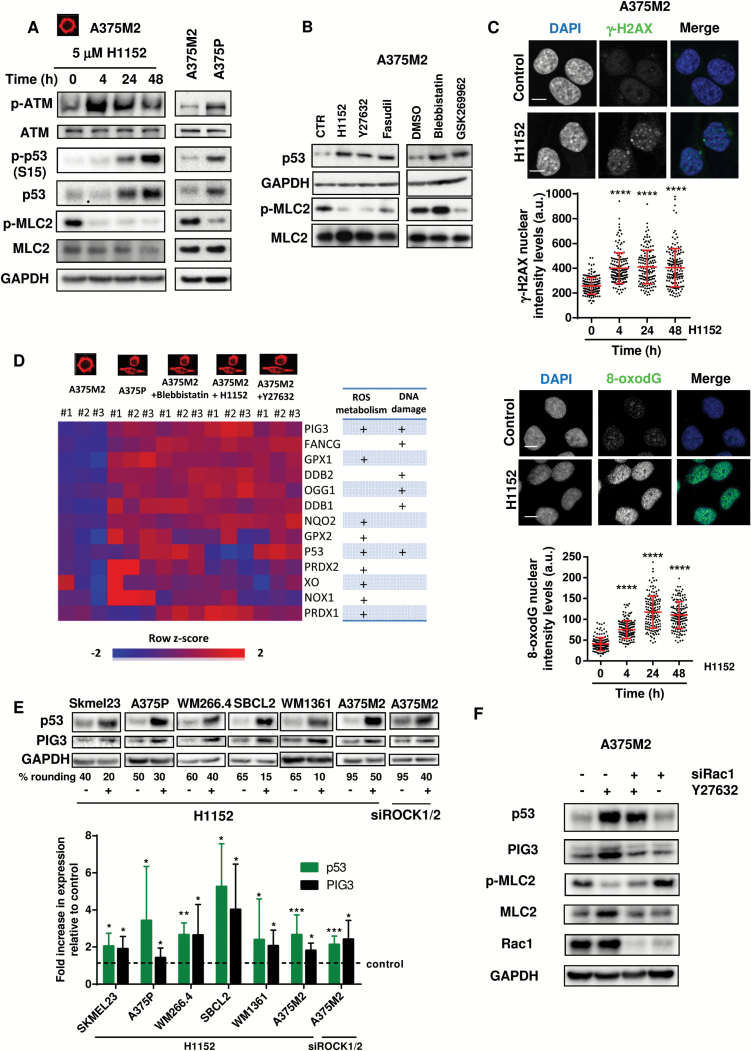
Figure 2.
Actomyosin contractility and DNA damage. A) Immunoblots for p-ATM, p-p53 (S15), p53, and p-MLC2 of A375M2 and A375P cells treated with ROCK inhibitor H1152 (5 μM) for the indicated time points (n = 5, representative blots are shown). B) Immunoblots for p53 and p-MLC2 levels of A375M2 cells treated with ROCK inhibitors H1152 (5 μM), Y27632 (10 μM), Fasudil (10 μM), and actomyosin inhibitor blebbistatin (20 μM) and ROCK inhibitor GSK269962 (1 μM) (n = 5, representative blots are shown). C) Top panel: representative confocal images (top) of γ-H2AX (green) immunostaining in A375M2 cells treated with ROCK inhibitor H1152. DAPI was used to stain DNA (blue). Scale bar = 10 μm. Quantification of the nuclear levels in arbitrary units (a.u.) of γ-H2AX in A375M2 upon ROCK inhibition (H1152) from three independent experiments is shown below (n = 3 experiments; N = 150 nuclei, error bars are ±SD, two-sided one-way analysis of variance (ANOVA) with Tukey’s post hoc test was used to generate P values, ****P < .0001). Bottom panel: representative confocal images (top) of 8-oxodG (green) immunostaining in A375M2 cells treated with ROCK inhibitor H1152. DAPI was used to stain DNA (blue). Scale bar = 10 μm. Quantification of the nuclear levels in arbitrary units (a.u.) of 8-oxodG in A375M2 upon ROCK inhibition (H1152) from three independent experiments is shown below (n = 3 experiments; N = 150 nuclei, error bars are ±SD, two-sided one-way ANOVA with Tukey’s post hoc test was used to generate P values, ****P < .0001). D) Heat map of ROS-regulating gene expression following inhibition of actomyosin contractility in A375M2 cells—conditions shown are A375M2 cells, A375P cells, A375M2 cells treated with blebbistatin, H1152, or Y27632. Blue indicates under expression, red overexpression, and intensity of color indicates relative change. Rows were colored using a z-score derived from a gene’s expression across all samples (row z-score). A table indicating the involvement of these genes in ROS metabolism and/or DNA damage is shown on the right. E) Representative immunoblots (top) and quantification (bottom) of p53 and PIG3 levels in human wild-type TP53 melanoma Skmel23 (n = 5), A375P (n = 10), WM266.4 (n = 5), SBCL2 (n = 5), WM1361 (n = 13), and A375M2 cells after treatment with ROCK inhibitor H1152 (5 μM) for 24 hours (n = 10) or after abrogation of ROCK1 and ROCK2 with siRNA for 72 hours (n = 7) in A375M2 cells (error bars are ±SD, two-sided Student’s t test was used to generate P values, *P < .05, **P < .01, ***P < .001). F) Representative immunoblots for p53, PIG3, p-MLC2, and Rac1 of A375M2 cells after depletion of Rac1 for 72 hours and ROCK inhibition treatment with Y27632 (10 μM) for 24 hours (n = 4). See also Supplementary Table 1 and 2 and Supplementary Figure 2 (available online).

