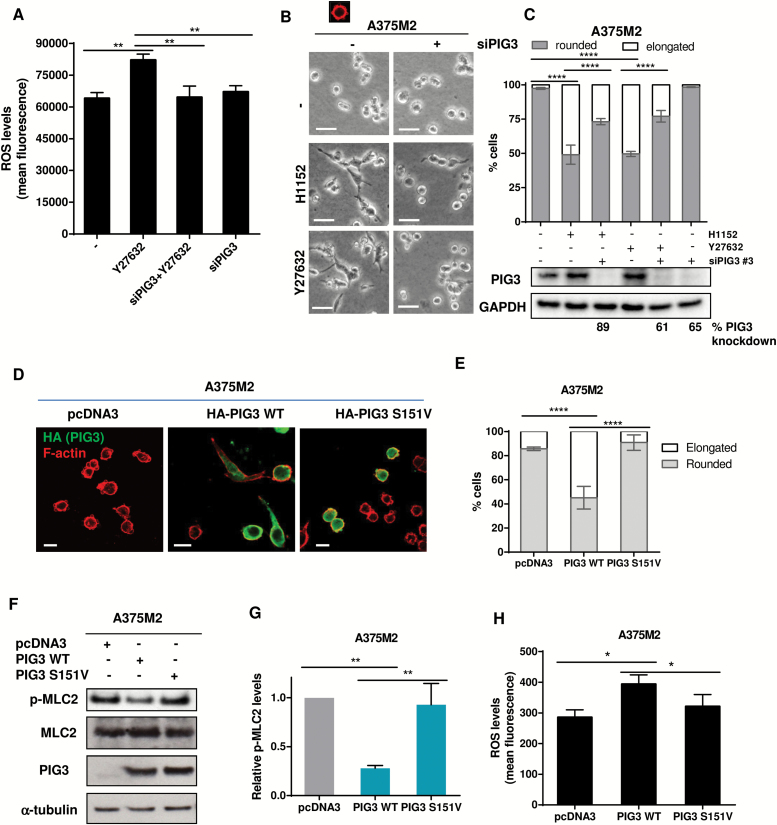
Figure 4.
PIG3 catalytic activity and the actomyosin cytoskeleton. A) ROS measurements of A375M2 treated with ROCK inhibitor Y27632 (10 μM) for 24 hours after depletion of PIG3 by siRNA. Values are represented as relative mean fluorescence (n = 3, error bars are ±SD, two-sided one-way analysis of variance (ANOVA) with Tukey’s post hoc test was used to generate P values, **P < .01). B) Representative bright-field images of PIG3-depleted–A375M2 cells on bovine collagen I and incubated with ROCK inhibitors H1152 (5 μM) or Y27632 (10 μM) for 24 hours. Scale bar = 20 μM. C) Cell morphology of A375M2 cells on top of bovine collagen I after PIG3 depletion prior to treatment with H1152 (5 μM) or Y27632 (10 μM) for 24 hours (n = 3, error bars are ±SD, two-sided one-way ANOVA with Tukey’s post hoc test was used to generate P values, ***P < .001, ****P < .0001). Percentage of PIG3 knockdown is shown below. D) Representative confocal images of PIG3 (green) immunostaining in A375M2 cells transiently transfected with empty vector pcDNA3 or with the constructs HA-PIG3 WT or HA-PIG3 S151V on bovine collagen I. F-actin was also stained (red). Scale bar = 20 μm. E) Cell morphology of A375M2 cells overexpressing HA-PIG3 WT or HA-PIG3 S151V on bovine collagen I matrix (n = 4, error bars are ±SD, two-sided one-way ANOVA with Tukey’s post hoc test was used to generate P values, ****P < .0001). F) Representative immunoblots for p-MLC2 and PIG3 protein levels in PIG3-overexpressing A375M2 cells (n = 3, representative blots are shown). G) Quantification of MLC2 phosphorylation levels normalized to cells transfected with the empty vector (n = 3, error bars are ±SD, two-sided one-way ANOVA with Tukey’s post hoc test was used to generate P values, **P < .01). H) ROS measurement of A375M2 cells transfected with empty vector pcDNA3, PIG3 WT, or S151V PIG3. ROS levels were represented as relative mean fluorescence (n = 4, error bars are ±SD, two-sided one-way ANOVA with Tukey’s post hoc test was used to generate P values, *P < .05, **P < .001). See also Supplementary Figure 4 (available online).

